
Happy Fry-day! 🍳
Do you ever lay awake at night and wonder how much your neighbors spend on canned ham each year? What about their video game budget or annual snack food spending?
Well I have good news for you… Today’s guest post from MoneyLemma reveals these very important statistics — and more — while digging through the average household budget. Enjoy…
*****
Time to gossip for the sake of financial well-being …
Other people’s money is none of your business, and thus inherently interesting.
More importantly, that information is useful. Benchmarking, or using average data as a baseline, is helpful for making a budget and identifying poor spending habits, like buying a non-refundable $28 million ticket to space and then double-booking the calendar:

Understanding how money flows through society is also part of being an informed citizen; it’s an antidote to misinformation. This post examines how Americans spend their money and how that information can help you manage your own household expenses. By the way, this post uses 2019 data because, you know, 2020 was weird.

Average American household income and spending
In 2019, the average U.S. household made $71,487 after taxes. Of that, $8,451 was saved and the rest was spent.
Here’s a more detailed breakdown of household spending, which shows that housing is the biggest expense, followed by transportation, insurance, health care, and then other stuff:
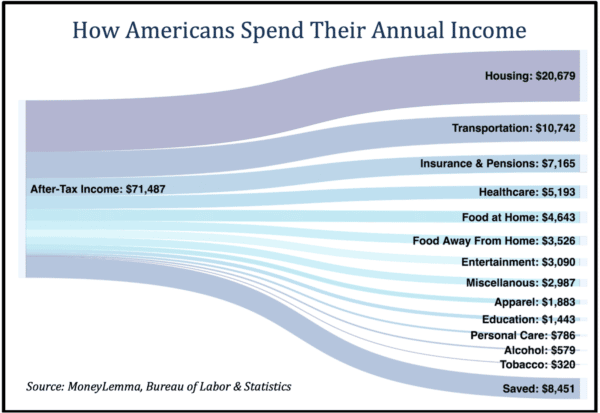
Add it all up, and we see that 68% of after-tax income is spent on housing, transportation, insurance, healthcare, education, and food prepared at home (mostly grocery spending). For the most part, those are necessities, i.e., non-discretionary spending.
Over time, the cost of some of these necessities has generally increased (a.k.a. inflation), which we millennials love complaining about … I mean, seriously, am I ever going to own a home? I’d need a mortgage payment just for a storage locker.
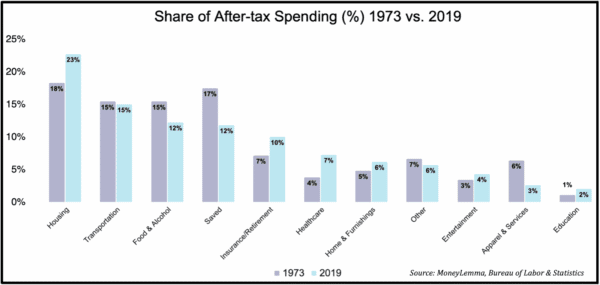
Here, we can see that Americans’ share of after-tax spending on housing costs has grown to 23% in 2019 from 18% in 1973. The budget percentages on insurance and health care expenses have risen, too.
To be fair, the value received in some of these spending categories has arguably increased with the cost. Healthcare today is better than healthcare in 1970, which we see by the rise in life expectancy:

And the average home is bigger:
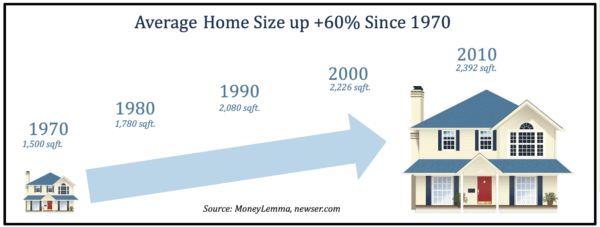
Reconciling the contradiction that we are both richer and poorer than our parents’ generation is an interesting topic in and of itself.
Household discretionary spending
The typical household spends about $1,200 per month on everything discretionary. That covers a lot: restaurants, Fortnite skins, taxidermy, must-have 90’s nostalgia collectibles, vintage combs, secret love affairs, hush-money payments to estranged former lovers, divorce lawyers, trips to Vegas with the boys, shotgun weddings, divorce lawyers again, desperately starting a personal finance blog to pay off all the lawyers … I’ve said too much.
The biggest discretionary bucket is food away from home, which means food prepared by someone outside the household. The average household spends $294 per month, or $3,528 per year, on eating out.
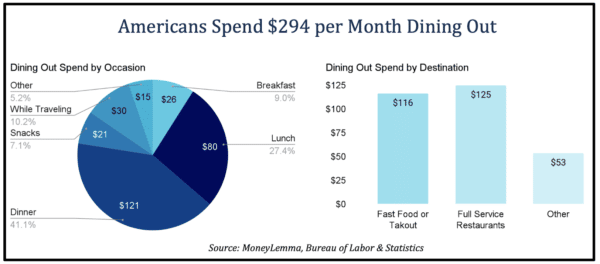
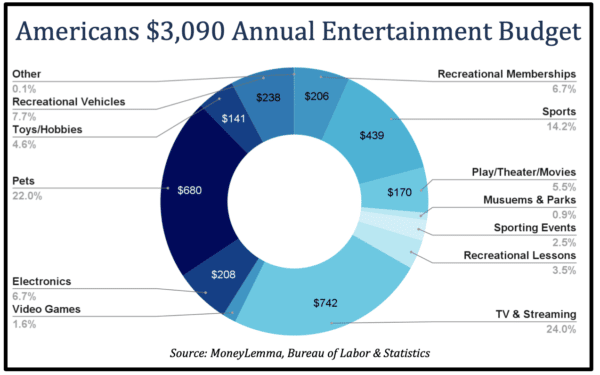
The second-largest non-essential household expenditure is entertainment, which accounts for about $250 per month, or $3,090 per year. (For some random reason the BLS classifies pet expenses as entertainment.)
(An aside … Americans don’t need to save more. They need to save smarter)
A 2019 Northwestern Mutual study found 90% of Americans don’t think they’ll have enough money to retire. But the average household doesn’t need to be so insecure … the BLS survey reveals that American households are saving $704 per month.
Here’s what that could look like over a 30-year period if invested well.
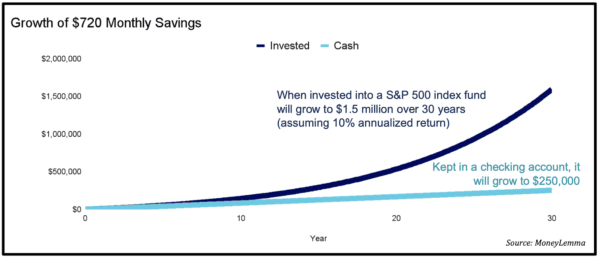
In other words, monthly savings of $720 will grow to $250,000 if it’s kept in a checking account for 30 years. Invest it? It’ll grow to $1.5 million in the same amount of time.
As long as household savings are invested wisely, most Americans will end up with a sizable nest egg. There’s also social security, insurance, and pensions that aren’t included in these numbers. Bottom line, the data is much stronger than American confidence. C’mon America!

If you want to learn more about what “investing well” means, check out MoneyLemma’s post on why 401ks exist.
How comparing household budgets can help you
I, for one, would love to know what my neighbors are spending on canned ham or ripped jeans. That urge is more than just curiosity — it’s research. Hard data can provide some context for budgeting; it’s a frame of reference.
For example, let’s say you are looking to tighten your pursestrings and save a little more. You’re reviewing your expense habits and figure you spend $2,000 per year on clothes. Is that a lot? A little? Everything in personal finance is relative and subjective, so it’s hard to say. Benchmarking, though, can help you arrive at a conclusion with confidence.
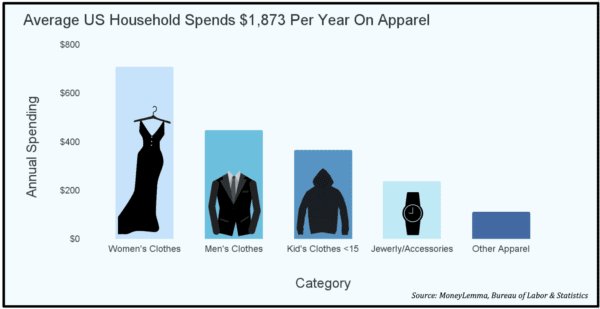
Here’s a rough visual breakdown of the average American household’s apparel spending (with women’s clothing claiming the top spot):
This is a good start but might not be relevant to your household type, like if you’re living alone. Plus, discretionary spending is a function of income — the more disposable income, the more you can spend on clothes.
Here’s a breakout of apparel spending by single women based on income:
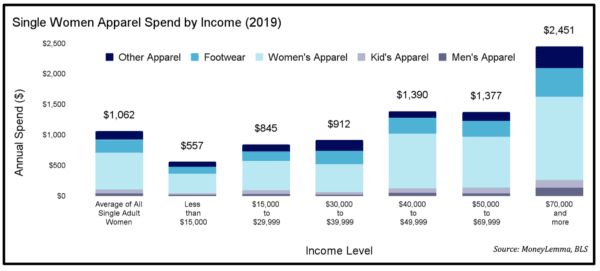
You’ll see that women who make less than $15,000 spend $557 a year on clothing. Women who earn $40,000 to $50,000 spend about twice that.
This kind of contextualizing can help you understand where you stand. If you spend a lot of money on clothes, that’s fine — but checking the data keeps you honest with yourself, which makes you more thoughtful about your decisions.
Where to get more data on Americans’ spending habits
Most of the data in this post comes from the US Bureau of Labor and Statistics (BLS) Consumer Expenditure Survey. They publish really detailed data. If you can’t be bothered to dig through their files for analysis, I don’t blame you (it’s boring), but even just googling or asking some peers about their normal household bills is better than nothing.
The goal of benchmarking as a budgeting method is to get an outside perspective. Even if you just ask one friend, or just google one statistic, it can help you get a little perspective. Even small efforts to be intentional and thoughtful can make a big difference — and this is not the first time I’ve ended a personal finance post on that point.
As a parting thought, here’s the answer to my burning question on our fellow Americans’ average spending on canned ham: $0.78 per year.

So, which out of these stats surprised you most? How does your spending stack up???
MoneyLemma writes about the overlap between your money and your world. Check out the MoneyLemma post archive.
Get blog posts automatically emailed to you!


Fantastic guest post — thanks for the deep dive! I came into this prepared to feel smug, but then I discovered our bacon and sausage budget blows these animal meat numbers out of the water. Yikes.
Also a bit of guilt. Our savings numbers are far higher… which suggests we’re balancing out a household who, for whatever reason, can’t.
Adam… being above average for savings/income/net worth just means that you have a bigger platform for giving back and helping those less fortunate. Don’t feel guilty, feel blessed.
Thanks Adam! I had fun pulling it all out and also missed a lot. I totally agree with Joel – it sounds like you are in a good position, nothing to be guilty about!
The other thing about the numbers is that there’s a lot of layers to it. For example, if you break it up by income brackets it looks very different. I did some of that here – https://moneylemma.substack.com/p/the-notorious-1-who-are-they
I’m giggling over separating Canned Ham and Ham. As you can see, I focus on the really important stuff.
I think the biggest surprise is how low the electronics spending is, at $208 per year. I replace my $250ish android phone and heavily used $600ish laptop roughly every 4 years, and I’ve had my Kindle Paperwhite (a gift) since 2012. So I hit that average…but I suspect I’m at the low end of electronics spending.
I’m trying to figure out where travel/vacations fit into these (pretty awesome) charts. Transportation? Other? Combination of the two?
I really love your charts – GREAT guest post!
I get what you mean about electronics… I actually think my wife and I are over this average, and I would have guessed we’re on the low end. Good question on the travel averages – I have no idea! I guess everyone travels differently depending on their travel style. Knowing the average spend would be nice, but also probably irrelevant to the budget my wife and I have set :)
Thanks Katie! Great question on travel. Travel spending is spread across a few of these buckets. Here’s some more detail:
Within food there is a category for “meals while traveling” that was $420.
And the housing number does include owned vacation homes ($260 per household) & lodging on out-of-town trips ($620).
Included in transportation is gasoline while traveling ($120) and car rentals ($60) and airline fares ($500).
There are also a few line items within entertainment and miscellenaous that (example – recreation while out of town) that add up to about $200.
The data is so granular that there are even more line items, but these are the big ones. If we add all those up, we get an just over $2,000 per household.
I agree with you on electronics – an iPhone is $2,000! Even if you keep it 5 years, a lot of people are averaging $400 just from that. TVs are similar. It makes me wonder if the survey classifies some newer products as miscellaneous that we might consider electronics. They’ve been doing this survey since the 1970s and it’s the government, so my guess is they are slow to incorporate new technology. They even still have a line item for phonographs in there (it is literally less than 1 penny per person)
Where’s the fish? Please tell me it isn’t lumped in with the $14 of “Lamb and Other Meats” category. And apparently my house size is from 1970 (whatever, it’s paid off – she says even though she would like a bit more space) Whether it’s detailed salary data or consumer spending data, I really love info from the BLS. That website is really dry, though, so articles like these provide way more value. :-)
Very thankful for bloggers like MoneyLemma who dig through the BLS data and interpret it in fun ways… I’m way too lazy to do it myself haha!
Oh, I found the fish. lol It’s a line item in the CE Tables Category – Income before Taxes (which also goes into expenditures). That table is insanely interesting, as it breaks down the expenses by income bracket. There was another table breaking it out by region. For example, the South pays the least for Natural Gas, but the most for electricity. The West spends the most on water, by quite a bit, too. I may have had too much fun already. Probably need to check out MoneyLemma. lol
haha, you beat me to it! I excluded fish from the table because if I didn’t, I would have so many categories the chart would look terrible. So fish not included on a technicality. For everyone else reading – fish is $145 per household and the biggest sub-category within that is fresh fish ($76)
I agree – I feel like I didn’t even scratch the surface of this data. It’s amazing how many different ways they cut it and what can be gleamed.
I’m pleasantly surprised that the average household is saving over 10%.
My household income varies because I make commissions but I’m usually between 140k and 180k so I’m lucky and we are overspend on eating out and kids travel sports which are related. We are crazy busy which makes it easier to justify eating out. If my income changed and I found myself needing to cut spending those are the first two categories I would look at.
I was surprised as well! But you might guess though that the savings vary widely by income level.
Households making below ~$70,000 spend more than they make, on average. The median household income in this country is $61k. That’s why we see a lot of articles that half of Americans aren’t saving at all. After going through all this data I’m not surprised by that – living is expensive! Depending on location, you could easily spend $50k on necessities.
Households in your bracket – $150k to $200k – save about $35k per year on average.
Also on eating out – spending more on that is the trend, so maybe you are ahead fo the curve! Check out this chart from the USDA: https://www.ers.usda.gov/data-products/chart-gallery/gallery/chart-detail/?chartId=90505
I’m doing my part to throw off the “dining out” budget category… a little out of whack these days! Great information all the way around!
Great article with great information. So many details to parse through! One thing that really sticks out to me is how the size of house has gone up so much from 1970. We live in a 1960s house (built then) that is 2,100 square feet. Honestly, we have multiple (more than 2 kids), but it meets our needs really well.
I think the problem today for some families and people is keeping up with Joneses, and the biggest two categories are “cars” and “housing”. I see that in your spending for the categories above. Very interesting and good take!
Keeping up withe Jones is part of it for sure! I actually did a separate post on this exact topic: https://moneylemma.substack.com/p/are-americans-getting-richer
The housing market is another interesting point. It seems like it goes up every year…
This a fantastic article! I love the cold hard facts, statistics and a little bit of humor rolled in! I totally agree on benchmarking against my neighbors. I have a neighbor in fact who has ever single service you could imagine.. grass cutting service, maid service, car detailing service, handy man who comes and stains his deck, etc. These are all things I do myself. Well, when he tells me about all these things he pays for, I have tactfully asked… “Do you mind if I ask you how much you pay for XYZ service?” He is happy to share and these things all add up to the high hundreds each month.
Question about the $8451 Americans average in savings. Does this include 401K contributions and company match? If so, it still feels like a pretty disappointing number. Assuming that this is all saved in a 401K and there is a 50% company match, 1/3 of this saving may be coming from the company. Still savings and still good, but I am sure way under what most people could do if they truly understood the numbers. Also sad because this data shows most people don’t even come close to maxing out a 401K and also may be leaving money on the table with the company match.
Thanks for writing articles like this that help people see how they can take control of their finances and be successful!
Hi Glasses Guy! Thanks for your comments.
I totally agree that it’s all these little things, especially when they are subscription or recurring costs, that end up as a huge financial hit. I have friends like that too, though, and I think they just are generally happy to pay for personal time (or don’t realize the cost).
The way I calculated the average savings per household is the difference between after-tax income and total expenditures. You make a good point, though – 401k savings and pensions are pre-tax so they wouldn’t be included. If we assume an average of 5% contributed to that, we’d have to add something like $3,000 to that balance. So even better!
I also posted this comment above and will re-post here:
The savings vary widely by income level. Households making below ~$70,000 spend more than they make, on average. The median household income in this country is $61k. That’s why we see a lot of articles that half of Americans aren’t saving at all. After going through all this data I’m not surprised by that – living is expensive! Depending on location, you could easily spend $50k on necessities.
Thanks for reading!