You can’t improve what you don’t measure. Implementing metrics at your startup is a surefire way to bring focus to your entire organization. As David Skok, General Partner at Matrix Partners, puts it, “One of the greatest things about putting in place the right metrics is that showing them to people will automatically change their behavior to try to improve the metrics. Furthermore, the metrics make it clear what levers they can use to change performance.”
In addition to helping your team focus and grow. Metrics are often the first thing a potential investor will ask to see during a fundraise. As your company moves further and further through the venture fundraising lifecycle – from Seed to A to Growth rounds – the numbers gain importance in the overall story for the fundraise.
How do you know what metrics to track for your startup? We’ve laid out a few basic metrics to get you headed in the right direction.
Startup Sales Metrics
Metrics are vital to track in every aspect of a startup but are especially important when it comes to sales. Generally speaking sales metrics can be measured on an individual, team, or organization basis.
By setting up a strong system to track your sales metrics you will be able to make better informed go-to-market decisions.
Revenue Metrics
Revenue is the lifeblood of a for profit organization. Revenue can come in many shapes and sizes. There are startups that track monthly recurring revenue, annual recurring revenue, service revenue, and more.
There are generally two types of revenue for a SaaS company – the first is Subscription Revenue (called MRR or ARR). This is product focused revenue that is recurring and predictable — especially if you are able to sign customers to longer term agreements. Investors prefer this type of revenue because it signals a high quality product with a path to long-term profitability.
The second type of revenue is Services Revenue which often comes in the form on one-off (read: not predictable) consulting engagements or implementation fees. Because of the human-capital intensive nature of providing these services, they are far less profitable and scalable than Subscription Revenue.
Related Reading: What is a Startup’s Annual Run Rate? (Definition + Formula)
Annual Contract Value (ACV)
ACV is “the value of the contract over a 12-month period.” If you are seeing an uptrend in ACV over time (which is generally the goal), then your company is likely doing one or many of the following things:
- Shifting to customers with a larger budget – more seats, usage, etc.
- Employing a more effective sales strategy to convince customers to invest more heavily in your product
- Building a product that continues to improve and provide increasing value
- Effectively upselling existing customers
Increasing your annual contract value will allow your company to increase customer acquisition costs.
Pipeline Value
The pipeline value is exactly what it sounds like, the value of all active deals in your sales pipeline. For example, if you have 10 deals that are actively be sold but at different stages you can calculate the value of all deals with their likelihood of closing.
For those 10 deals, let’s say they are all worth $100 and:
- 3 are new deals with a 30% chance to close
- 3 deals have sat a call and are interested in buying with a 50% chance to close
- 4 deals have received a contract and are ready to sign with a 90% chance to close
That would be (3 new deals x $100 x 30%) + (3 calls sat deals x $100 x 50%) + (4 contract deals x $100 x 90%) = $600 in pipeline value. You can also break this number down by different stages. For example, the pipeline value of your new deals from the example above would be $90.

Understanding your pipeline value gives you a good understanding of the health of your current pipeline and can help with future forecasts.
Activity Sales Metrics
Activity sales metrics can be used to track individual reps and teams efforts on a daily or weekly basis. A few examples of activity sales metrics would be number of phone calls made, emails sent, demos sat, etc.
Tracking these numbers can be helpful for a few reasons. The first is so you can understand where an individual or team may be lacking if they are struggling to hit quota or numbers. They can also be used to create and build a predictable cadence with your potential customers. This data can be used to understand where and when your customers are buying to improve the likelihood of closing a potential customer.
Startup Marketing Metrics
Setting up and tracking marketing metrics can be an intimidating endeavor. There are countless metrics to track. From individual campaigns to website traffic metrics there is a lot to cover. However, properly picking and tracking your startup’s marketing metrics will set up your go-to-market team for success down the road.
Without getting too bogged down by the countless metrics, we’ve shared a few of our favorites below:
Customer Acquisition Costs
As we have written in the past, “Customer acquisition cost is the sum total of the amount that it takes your business to acquire a customer, including time from your sales representatives and marketing and advertising expenses.
The customer acquisition cost definition: the total cost it takes to bring a customer from first contact to sale.”
When you sit down and think about it, a lot goes into acquiring a new customer. You may be running multiple paid campaigns online, have a dedicated marketing team, and are contributing to in-person events. Let’s say that all of your cost dedicated to acquiring customers was $10,000 for the month and you brought on 50 new customers. That would be a customer acquisition cost of $200.
In order to be a successful business that means that your CAC needs to be less than the revenue that your customers will bring in the door. CAC can tell you a lot about the sustainability of your business and marketing efforts.
Related Reading: Breaking Down the Nuances of Annual Contract Value (ACV)
Customer Lifetime Value
In order to understand how sustainable your customer acquisitions costs are you need to understand the lifetime value of your customers. Customer lifetime value is the amount that the customer will spend with the business throughout their relationship with the business.
Calculating lifetime value can change greatly depending on your business. For example, a SaaS company may have a customer paying a monthly subscription fee for years (their total lifetime value) where a real estate company may only make one transaction with a customer.
Constantly tracking your LTV is a great way to keep your CAC in check and make sure you are the path to a profitable and sustainable business.

LTV:CAC Ratio
The LTV:CAC takes the 2 metrics mentioned above and keeps it to a digestible and easily understandable metric. You simply take your customer lifetime value and divide it by your customer acquisition costs. Ideally you want this number to be greater than 3.
In general, a good lifetime value (LTV) to customer acquisition cost (CAC) is 3:1. If a customer is being brought in for $100, their lifetime value should be at least $300. Otherwise, you will be spending too much drawing in your customers; it will become important to fine tune, streamline, and optimize your marketing and your advertising. If your ratio is 1:1 this would mean that you are not making any money on new customers and will eventually run out of cash and go out of business.
Related Reading: Unit Economics for Startups: Why It Matters and How To Calculate It
Website Traffic
No matter the business, essentially every business has a website today. Getting leads to your website is a great way to increase marketing and sales metrics across the board. Having a deep understanding your website traffic is a great way to tweak and improve content, website copy, button copy, paid campaigns, and more.
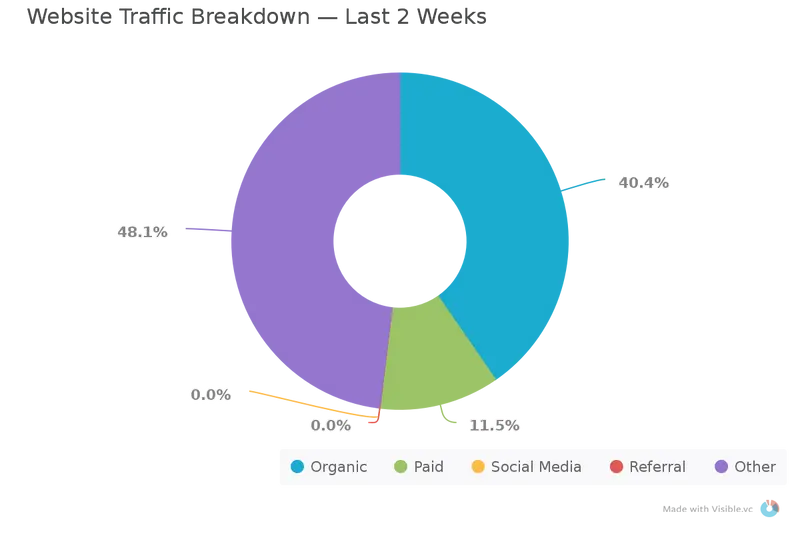
You will want to understand where your website traffic is coming from. This is generally referred to as the source. This can generally be bucketed into organic, paid, social, referral, and direct traffic. Knowing where your traffic is coming from will help inform your decisions for where to spend your time and budget. Example of a startup website traffic breakdown below:
Next you will want to understand what pages and content is converting well. For example, if you have a page on your website that converts to your call to action at a higher rate you will want to implement the ideas behind this page across the website. You should always be testing buttons and content copy to improve the likelihood of website users taking a specific call to action.
Startup Customer Success Metrics
Once you have a customer in the door, the work is not done. Being able to retain and grow your current customer base is the easiest way to grow your business. In order to do so, you need to have the right metrics in place so you can optimize what is working well when it comes to your customer success efforts.
Net Promoter Score
If you’re not familiar with NPS, it is used to gauge the loyalty of a firm’s relationships. It is used by more than 2/3 of the Fortune 1000 and it can measure a company, employer or another entity. You have likely received an NPS survey yourself. It’s a score of 1 to 10 usually with a question of “How likely are you to recommend X to your friend or colleague?”
X could be your company, your customer support experience, an event, etc. If you answer 1 to 6 you are considered a detractor and at risk of customer churn, 7 & 8 are considered passives and 9 & 10 are considered promoters. To get your score take % Promoters – % Detractors. This creates a scale ranging from -100 to 100. 0 to 49 is considered good, 50 to 70 is Excellent and 70+ is World Class.
To give you an idea for the 4 Major Airline Carriers in the US the scores are as follows:
American: 3
Delta: 36
Southwest: 62
United: 10
On the other hand of the spectrum Apple clocks in at 89.
Customer Churn
Customer churn is the % of customers (also called “logos”) that you lose over a given period of time. Let’s say that you have 10 customers and lose 2 of them over the past month. That would be a customer churn rate of 20%. Keeping your churn rate in check is an easy way to grow the business.
Revenue Churn
On the flipside revenue churn is the % of revenue dollars that you lose over a given period of time. Taking the example in the section above, let’s say that the 8 customers who did not churn are paying $100 and the 2 customers that did churn are only paying $10. That would be a churn rate of 2.4% ($20 in churned revenue divided by $820 in total revenue).
For world class companies they may actually have negative churn. This means that they are expanding current customers at a greater rate than they are losing customers.
Customer Retention Rate
As the team at HubSpot put it, “Customer retention refers to the ability of a company to — you guessed it — retain customers. Customer retention is impacted by how many new customers are acquired, and how many existing customers churn — by canceling their subscription, not returning to buy, or closing a contract.”
The formula to calculate your customer retention rate can be found in our Customer Retention Cohort Analysis template here.
Startup Operations Metrics
At the end of the day, every metric impacts how your business operates. If the metrics above are not falling into place, the chances of your business operating for the long run are slim. You need to constantly have a deep understanding of where you company’s financials stand.
Burn Rate
As Investopedia defines it, “The burn rate is the pace at which a new company is running through its startup capital ahead of it generating any positive cash flow. The burn rate is typically calculated in terms of the amount of cash the company is spending per month.” Burn rate is an essential metric for every early stage startup leader to have their eye on.
If your burn rate gets out of hand it is important to bring it in as soon as possible. Potential and current investors will have their eye on your burn rate to make sure you can sustain your current business practices for the future.
Months of Runway
Months of runway is exactly what it sounds like — the number of months your business can go on until it is out of cash. This is particularly important for early stage companies that have yet to find product market fit or are still in the early stages of developing their product. You can find your months of runway by taking your cash in the bank and dividing it by your net burn rate.
Related Resource: How to Calculate Runway & Burn Rate
Revenue per Employee
While revenue per employee is not the most informative metric for internal purposes it can be a great metric to benchmark against your peers. For example, if you are a seed software company comparing yourself to a publicly traded software company many of your metrics will not be comparable. However, revenue per employee allows you to break it down by the size of your business and have a benchmark to share with internal employees.
Related Resource: EBITDA vs Revenue: Understanding the Difference
Total Addressable Market
Total addressable market (TAM) is the estimated size of the market that your business can attack. As we wrote in our “Total Addressable Market Templated”, “TAM helps paint the picture of how big the opportunity is and if the business deserves to be venture backed.”
While TAM is not something that is tracked regularly it is important to have an understanding of your addressable marketing when you set out to fundraise.
Related Resource: A Guide to Building Successful OKRs for Startups
Startup Metrics Dashboards/Templates
Building A Startup Financial Model That Works
Check out our blog post and guide for building your first financial model (plus, a template to help you size your potential market). Check it out here.
Andreessen Horowitz Startup Metrics Template
Andreessen Horowitz (a16z) is one of the most prolific VC investors in the market today. With investments across a number of different stages, sectors, and business models, they have seen first hand the lack of (and the need for) standardization in the way private technology companies track metrics and present those metrics to current and potential stakeholders.
While their well known post, called “16 Startup Metrics“, dives deep into a number of great metrics for different business models – Marketplaces and Ecommerce in particular – we focused this video on SaaS metrics and how companies can use Visible templates along with other sources to benchmark themselves against others in the market and set themselves up for fundraising success. Check out a video explaining their metrics below:
Rockstart Digital Health Accelerator Startup Metrics Template
As with any early-stage company, focus is key. This is why Rockstart puts each company’s Most Valuable Metric front and center on the business dashboard. The primary reason to have a single, understandable metric for your business is to cut out the noise that comes with trying to track (and take action on) every single thing so that you can hone in on the one thing that drives your success. Read any startup post-mortem and you’ll quickly realize the negative impact that lack of focus can have on a company.
In the digital health sector, companies don’t all fit within the same bucket from a business model perspective. The first Rockstart Digital Heal Accelerator class has hardware companies (like Med Angel), marketplaces (like Dinst), and SaaS businesses (like Mount) who all likely have different true north metrics.