It’s official: music’s a $40bn business. Global Value of Music Copyright ramps up 14% to $41.5bn in 2022, with publishers clawing back share

Image: Unsplash/Pim Myten
10-MINUTE READ
Purpose
First thing’s first: Why do I go into a bat cave every October and calculate this figure? The primary answer is policy. There’s an axiom in lobbying circles that politicians are more likely to respond to bigger numbers than smaller ones.
This work gives us that number. Regardless of where you work in this complex music business, if you are trying to capture the attention of policy makers in Geneva, Washington DC, Brussels or London – this number is for you. Use it – not just one of its constituent parts. This work is here to help, and with AI music calling into question the future of human creativity by ‘training without compensating’, we’re going to need as much policy help as we can get.
The task of calculating the global value of music copyright involves consolidating three partly overlapping sources of industry analysis: (i) IFPI’s Global Music Report, (ii)CISAC’s annual Global Collections Report, and (iii) Music & Copyright’s analysis of music publishing.[1]
As with prior years, I will begin by saying ‘this year we’ve got a really big number to report’ – and this year, for the first time ever, that number starts with a four. This is a milestone that our policy makers need to know about.

Image: Unsplash/Jodie Walton
A Forty Billion Dollar Baby
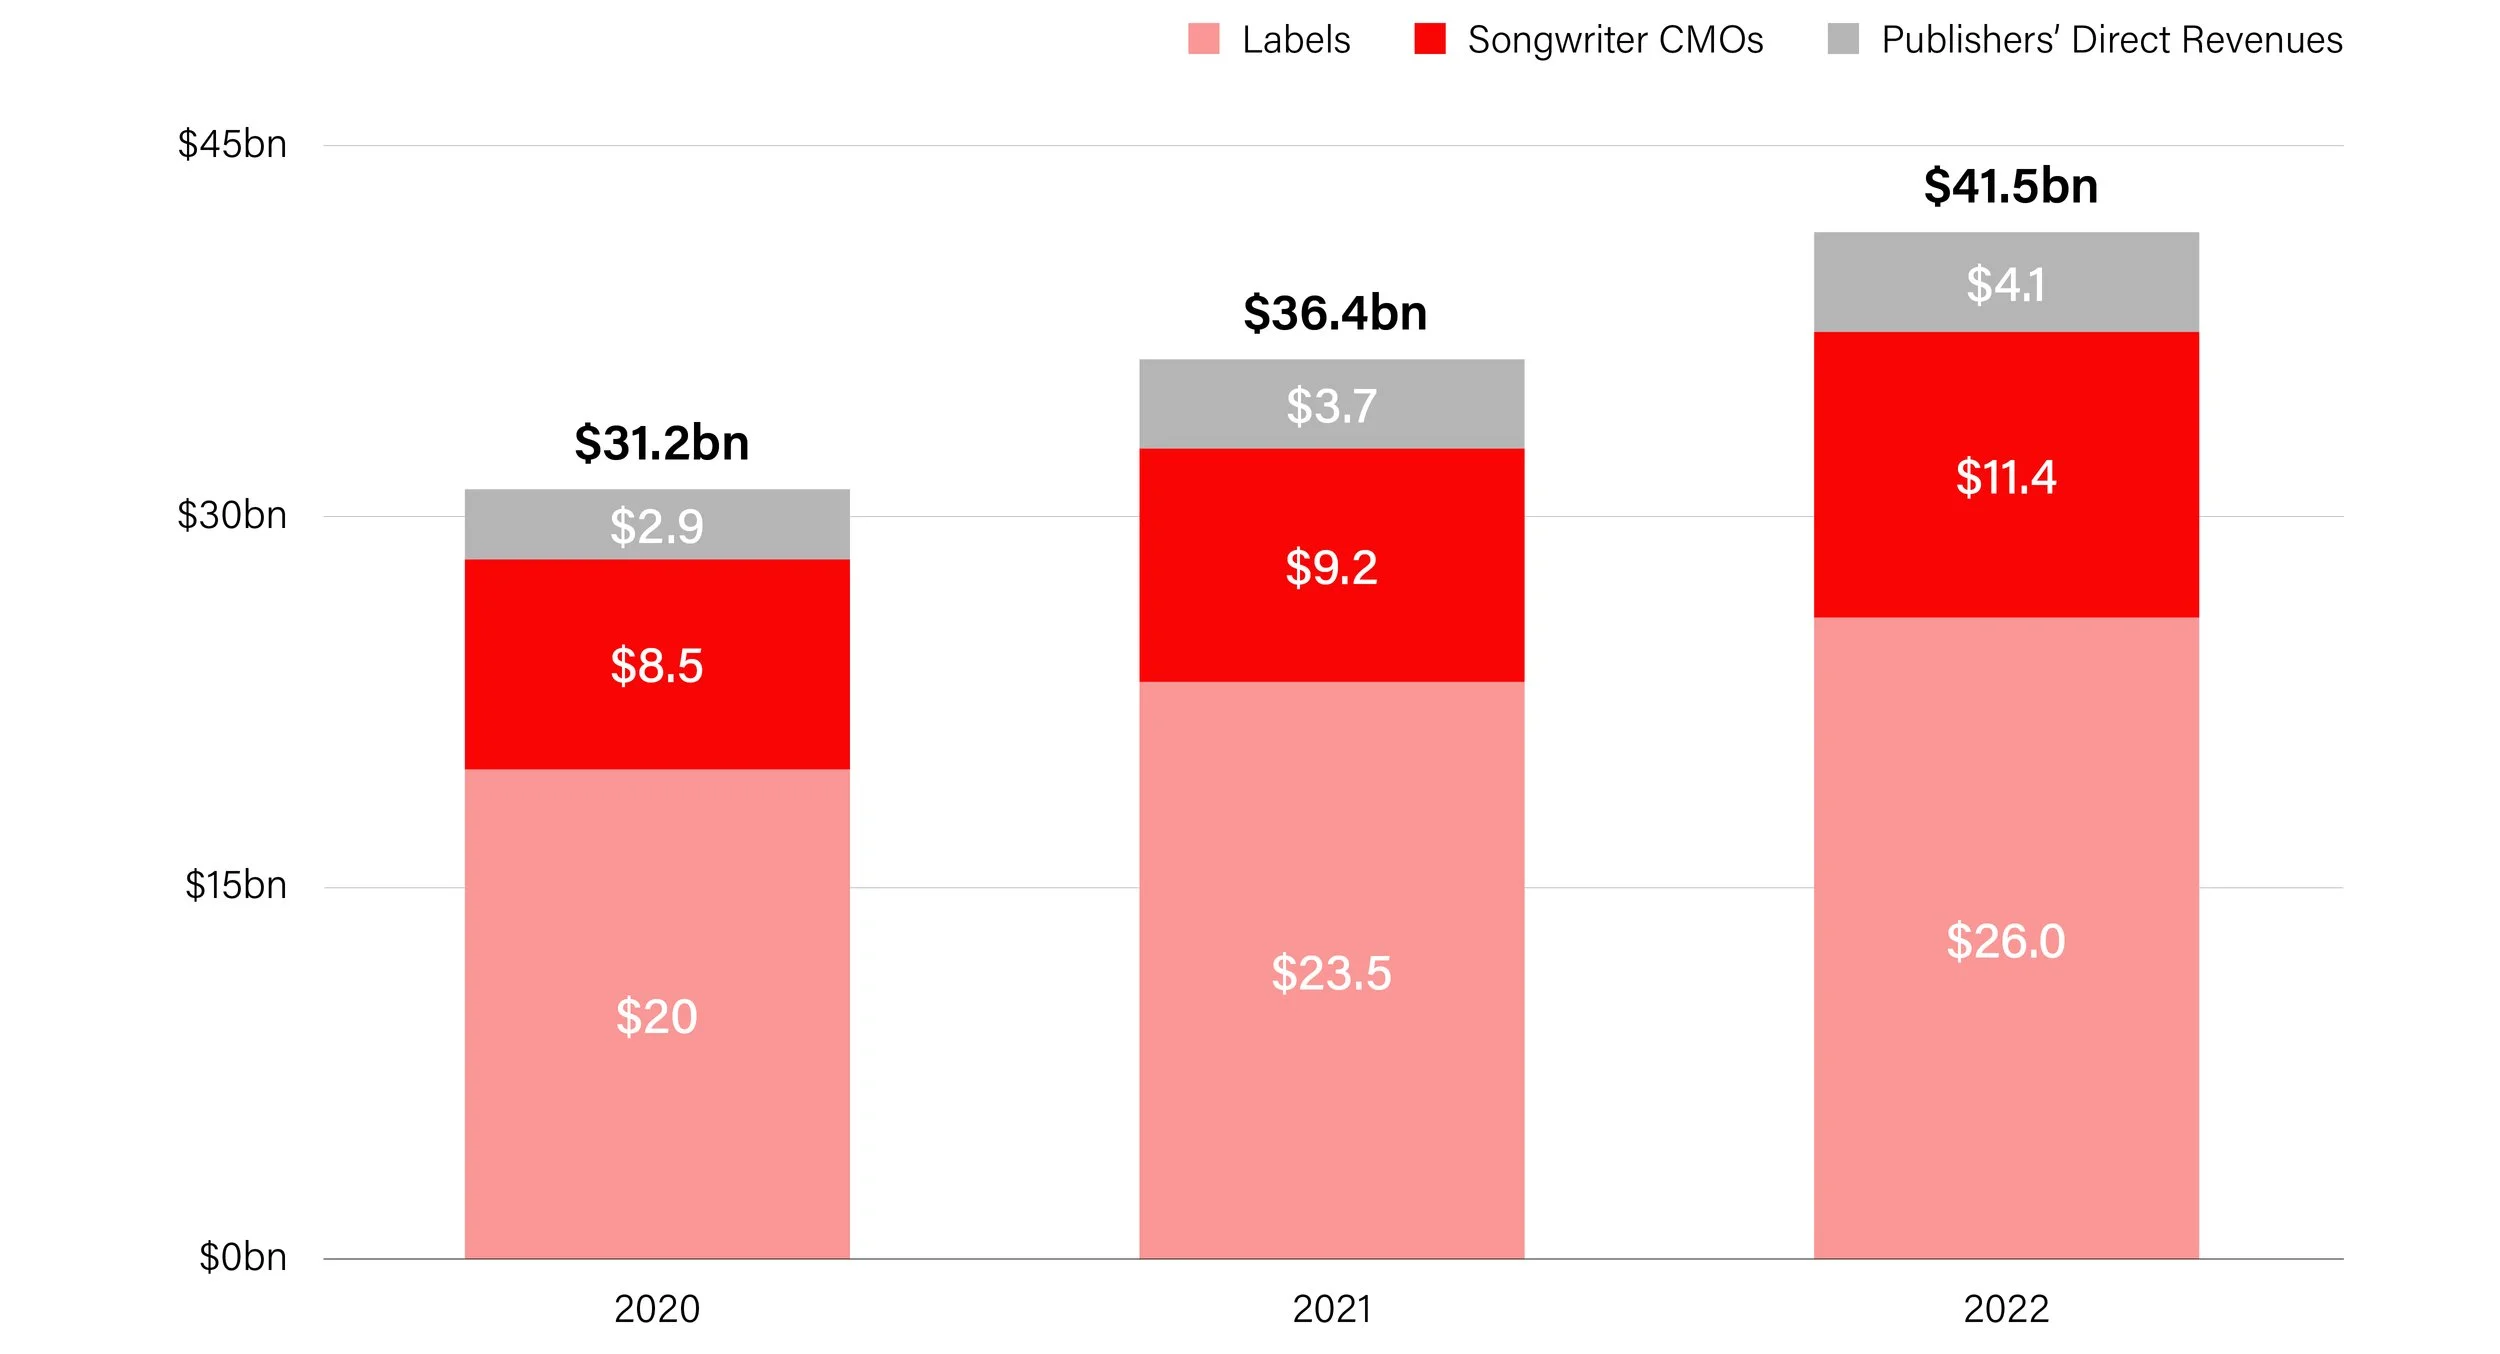
In 2022, music copyright was worth $41.5bn – considerably more than the $26.2bn reported in the same year’s IFPI Global Music Report (GMR), and up 14 percent from 2021. The first two years of the pandemic saw two ships pass each other in the night: streaming surged, while public licensing of concerts and hospitality stalled. Now, both ships are powering ahead together, with continued growth in streaming as CMOs bounce back strongly.
The chart below shows how labels made up most of the 2022 stack, with an adjusted $26bn, and publishers directly licensed $4.1bn; but the real story this year is the CMOs, whose collections topped $11.4bn. That means collections are a third bigger than they were in lockdown 2020. Performing-rights income have historically dominated this segment, and within that general purpose licensing leads the charge (e.g. restaurants, retail and concerts) – all of it bounced back beyond anyone’s expectations. Adding more wind into the sails are digital collections which have exactly doubled since 2019.
Global Value of Music Copyright
Source: IFPI Global Music Report, CISAC Global Collections Report, Music & Copyright, and Will Page
A blip or a trend?
It’s nuts to think that this ‘c’ with a circle around it – copyright – is now worth forty billion. For years music was ridiculed as the sick man of ‘media verticals.’ Now music copyright can stand tall. Some rough maths suggests spend on music is now more than twice global cinema worldwide box office, and just under half of the online video streaming market (but still a fraction of the gaming industry according to IDG Consulting).
Annual revenue growth shows that the value of copyright swelled $5bn in 2022 – an incredible feat. More striking still is that the spoils of growth are shared evenly between labels and artists on one side, and songwriters, publishers and their CMOs on the other – both adding around $2.5bn each.
The question on rights holders’ lips (and even more so investors’ who are paying record multiples for acquiring music catalogues) will be if this CMO-led rebound is a blip or a trend.
Three factors point to the latter. First is a post-pandemic correction. As public spaces opened up again, so, too, did the appetite for public performance: live music today is far bigger than it was pre-pandemic, albeit lopsided in favour of stadiums and festivals. Second, growth in CMO figures tends to be formulaic as inflation is embedded into blanket licences, hence why PROs always celebrate record collections. In a world of high inflation, we can expect even bigger record collections. Third, CISAC DG Gadi Oron points to a combination of “improvements in identifying content, licensing better and increasing rates” driving digital growth. More tellingly he says public performances collections are “not to the level of pre-Covid days. It’s close to that, but it’s not there yet.”
Meanwhile, the labels’ digital income growth shows signs of slowing down, especially in western markets. Yet, in what feels like an episode of ‘tales of the unexpected,’ this slowdown is being offset by the resurgence in adjusted physical income which has exploded by over $1bn since 2020, thanks to accelerating demand for CDs in Asia and insatiable need for the ‘platters that matter.’ in Europe and America. And this isn’t going to slow down. Take the rap artist Travis Scott’s release of Utopia in July 2023, where boutique pressing company Pressing Business pressed up a reported 500,000 double-vinyl records in different colours and covers, with the majority sold before the tour even commenced. Vinyl ain’t gonna stop spinning anytime soon.

Travis Scott (Image: Unsplash/Joel Muniz)
2022 on ‘21 Change in Music Copyright, $m
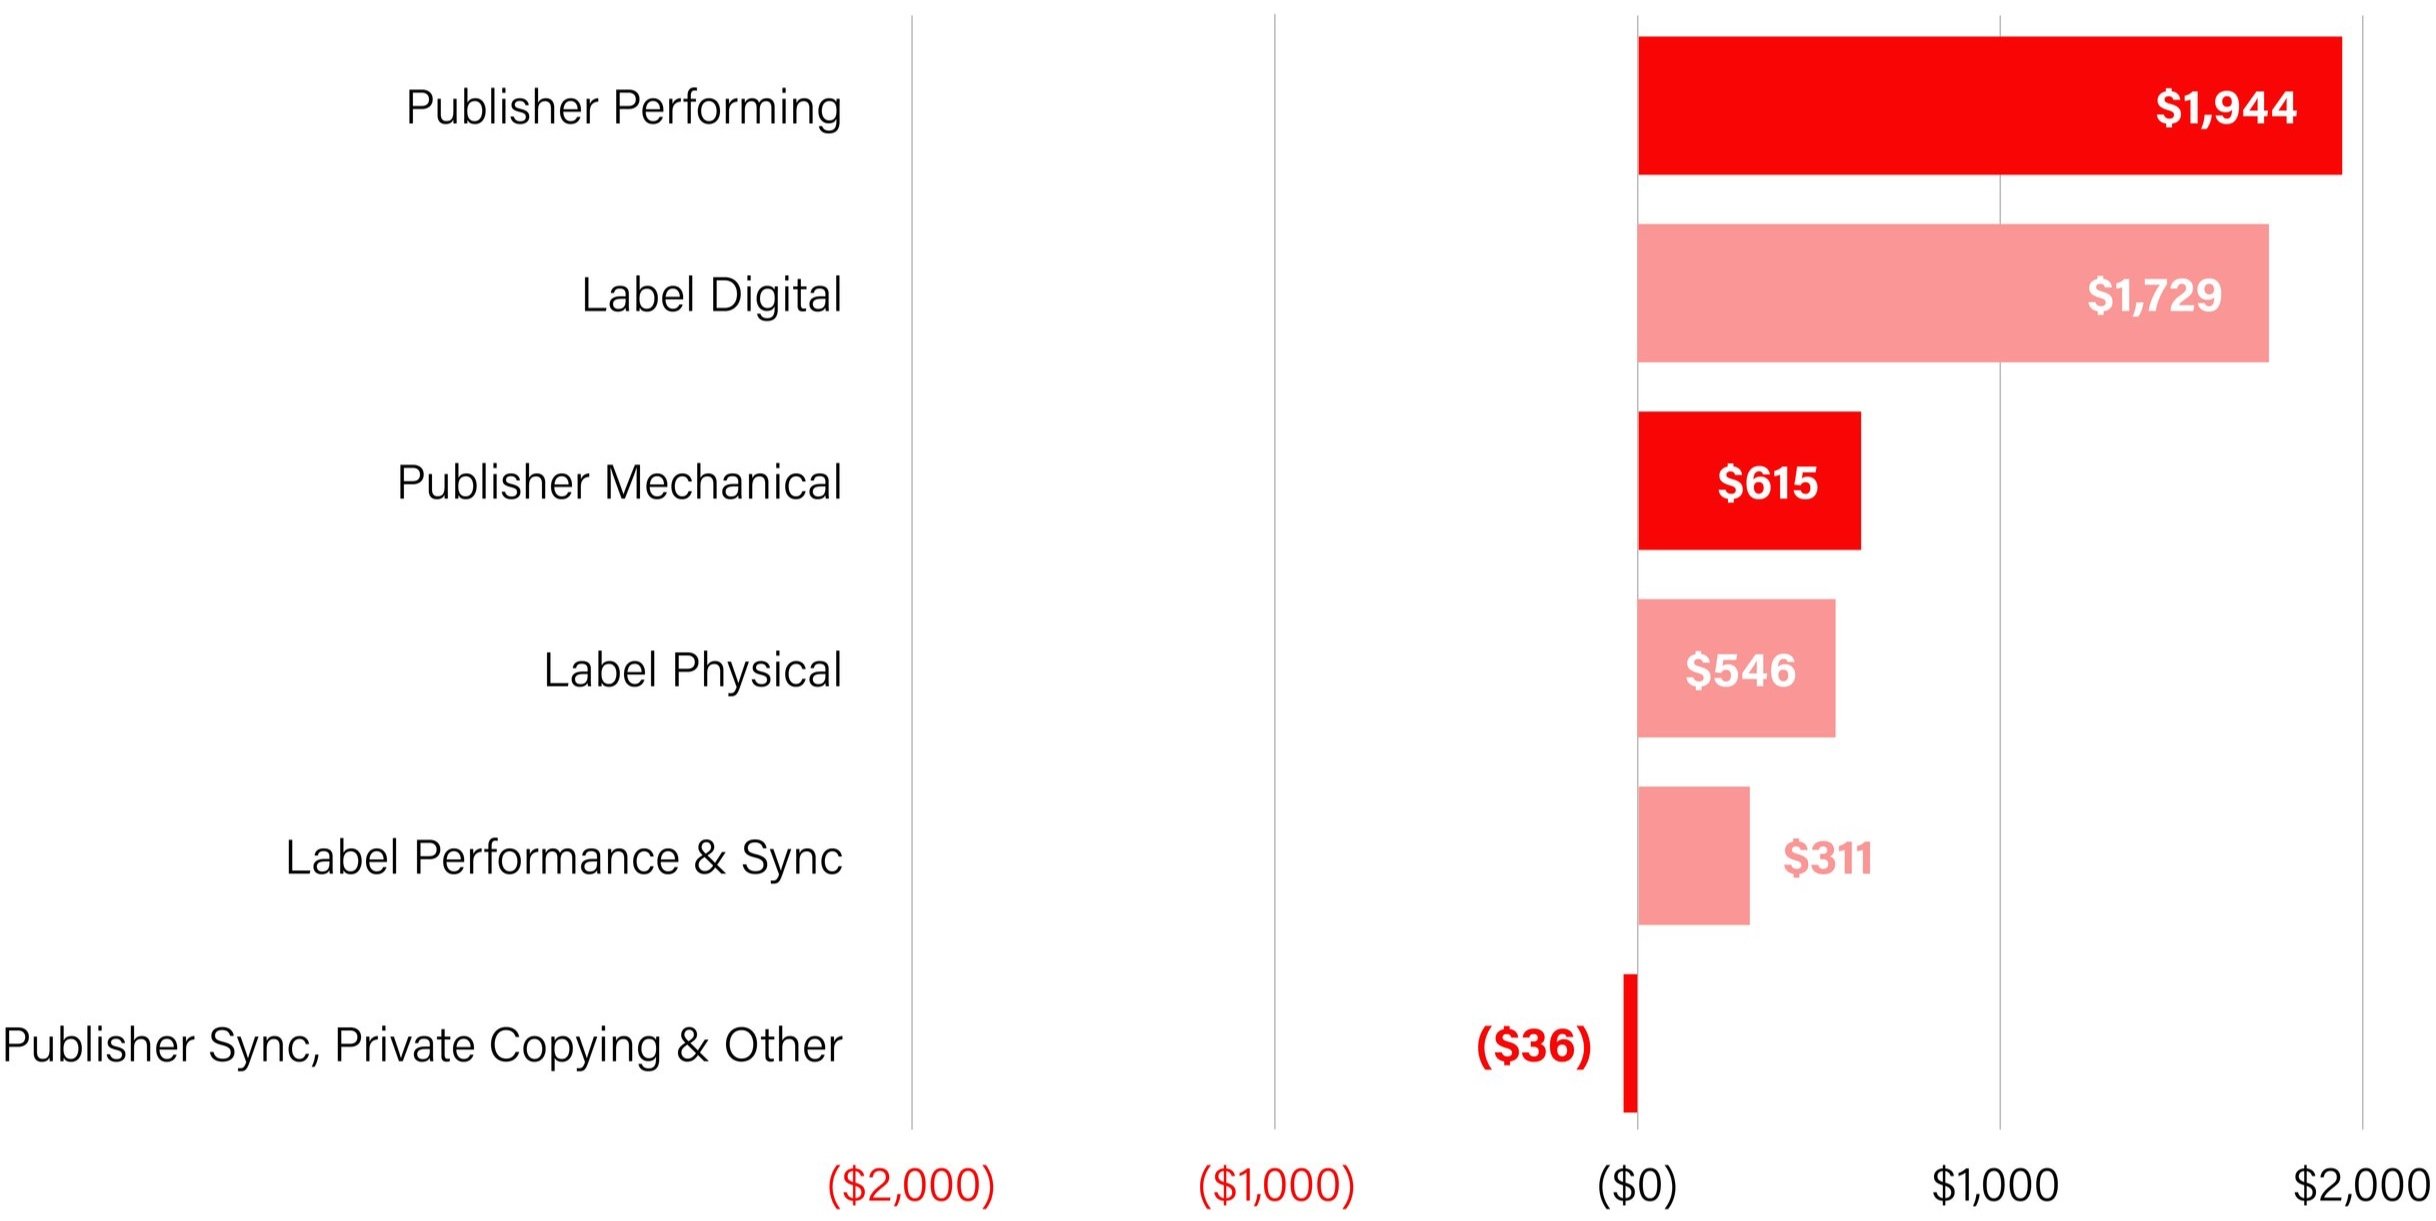
Source: IFPI Global Music Report, CISAC Global Collections Report, Music & Copyright and Will Page

Image: Unsplash/Elizeu Dias
The Great Restatement
Last year’s report offered a ‘smoke signal’ that exchange rates, namely the strengthening dollar, would make interpreting these globally sourced figures problematic. We weren't wrong. Recall the anomaly of Japan, and how its recorded music industry grew nine percent in 2022, but much of these gains were wiped out by the 18 percent collapse in the yen’s exchange rate against the dollar. Confused? Put bluntly, the methodology of constant currency screws with reality for the sake of presenting global sourced revenues into one comprehendible US dollar figure.
This year, we’re seeing a great restatement. Last year’s headline was $39.6bn in 2021, but now we’re wiping $3bn off that same figure due to updated exchange rates. As the dollar appreciated post-pandemic, it devalued what was published in last year’s report – with big drops in the IFPI and publishing‑adjustment figures. The other footnote to bear in mind is the removal of Russia from all the IFPI figures (and the omission of Turkey and Nigeria from CISAC), to ensure consistent reporting between years.
The Great Restatement: How FX wiped $3bn from last year’s report

Source: IFPI Global Music Report, CISAC Global Collections Report, Music & Copyright and Will Page

Image: Unsplash/Jesman Fabio
Fair division?
How this business gets divided up between artists and songwriters always raises a talking point about fairness.
Recall how consumer spend on music traditionally favours labels over songwriters, publishers and their CMOs (hereon in referred to as simply ‘publishing’), whereas business licensing traditionally favours publishers over labels. To flesh this out with some numbers, when a streaming service pays a label a consumer-generated dollar, that same streaming service will likely pay the publisher 30 cents. When a radio station pays a business-generated dollar to the publisher, that same radio station will likely pay the record label (providing they’re not American) 66 cents.
Since consumer revenues from streaming have driven the recovery, the scales have consistently tipped in favour of labels with every year of publishing this work.
This year, however, the scales edged back in favour of publishers, who took a 37% share of a $41.5bn business in 2022 – a bigger share of a bigger pie.
It’s the first year in a long time that I’ve reported the scales tipping back, and there are several reasons why. The post-pandemic bounce-back is one. The ‘lag effect,’ where labels will often licence new sources of revenue first (e.g. TikTok, Peloton), and publishers second, is another. A third potential reason is early accruals of the ‘pay raise’ publishers were awarded in the recent Copyright Royalty Board, granting them a greater share of streaming revenue – a decision that will fully crystallise when the 2023 figures are calculated.
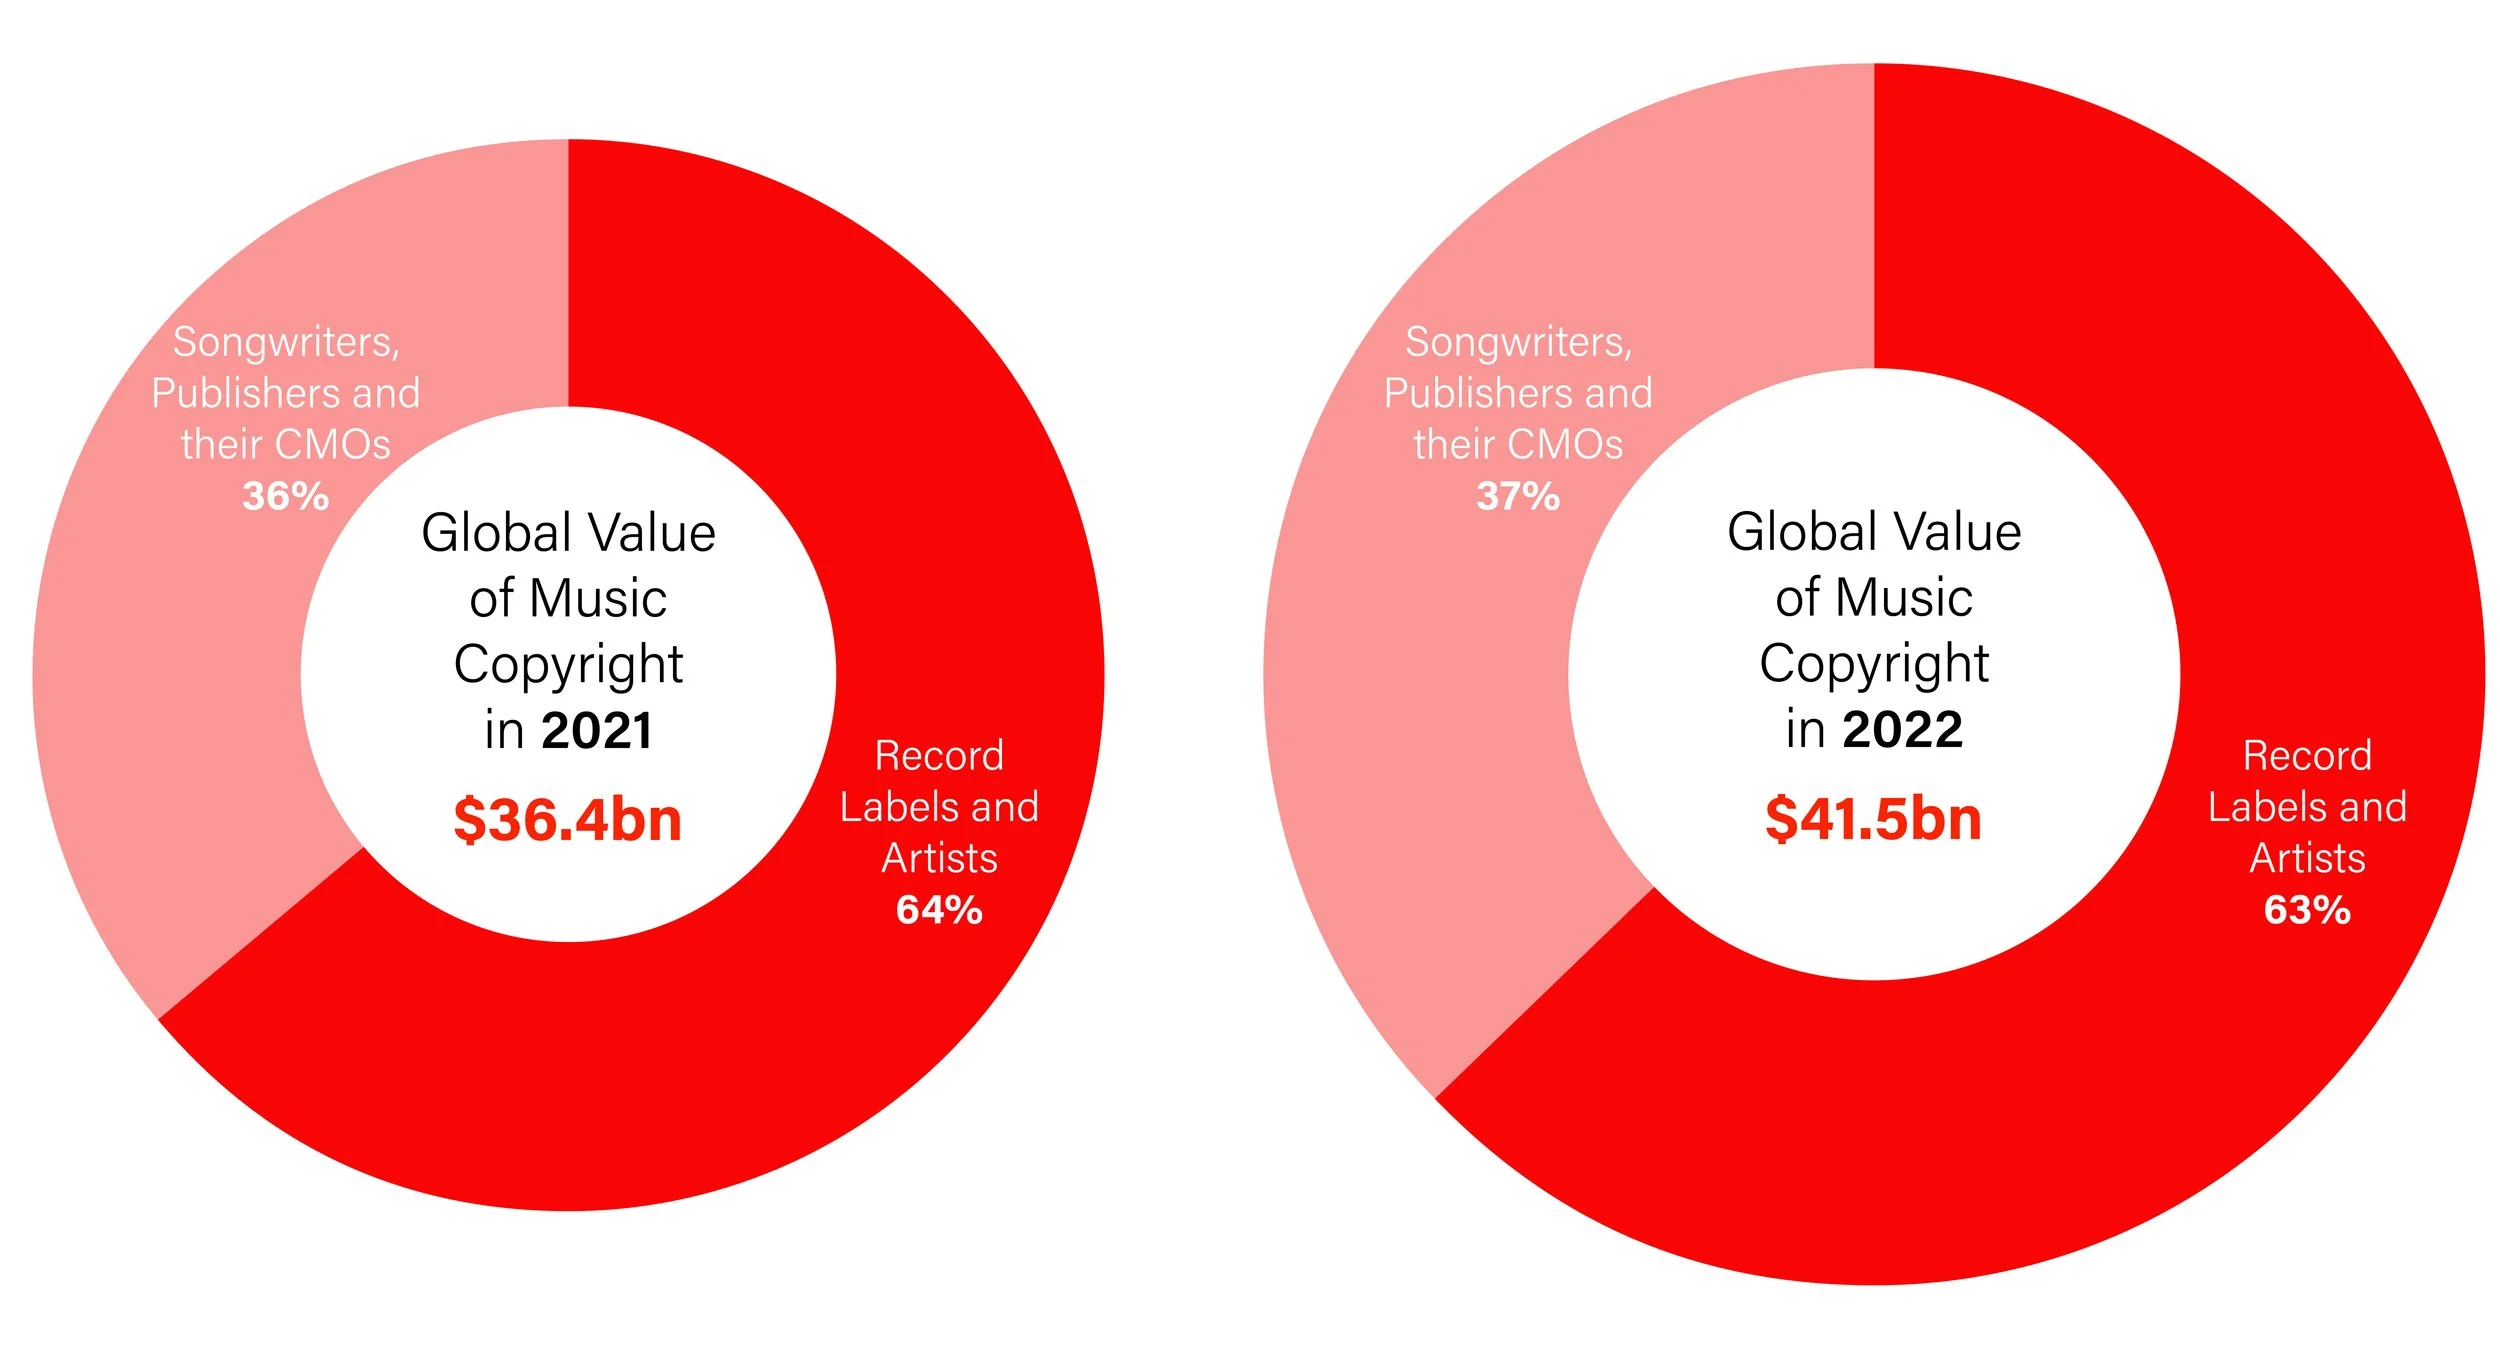
Source: IFPI Global Music Report, CISAC Global Collections Report, Music & Copyright and Will Page
Nevertheless, there is still a tendency to reflect on the CD era as the ‘good old days,’ when record labels used to sell CDs to stores by the ‘weight-of-pallet.’ To show why that nostalgia is now misplaced, we can reverse engineer the consumer-generated revenues IFPI has reported since 2001 and calculate what songwriters, publishers and their CMOs received from the same sources.
Back at the turn of the millennium, publishers saw $2.5bn of (largely) CD revenue ‘passed through’ to them from record labels. Today, they’re earning $5.5bn from streaming – that’s more than double.
Global B2C Revenues to Songwriters, Publishers and their CMOs
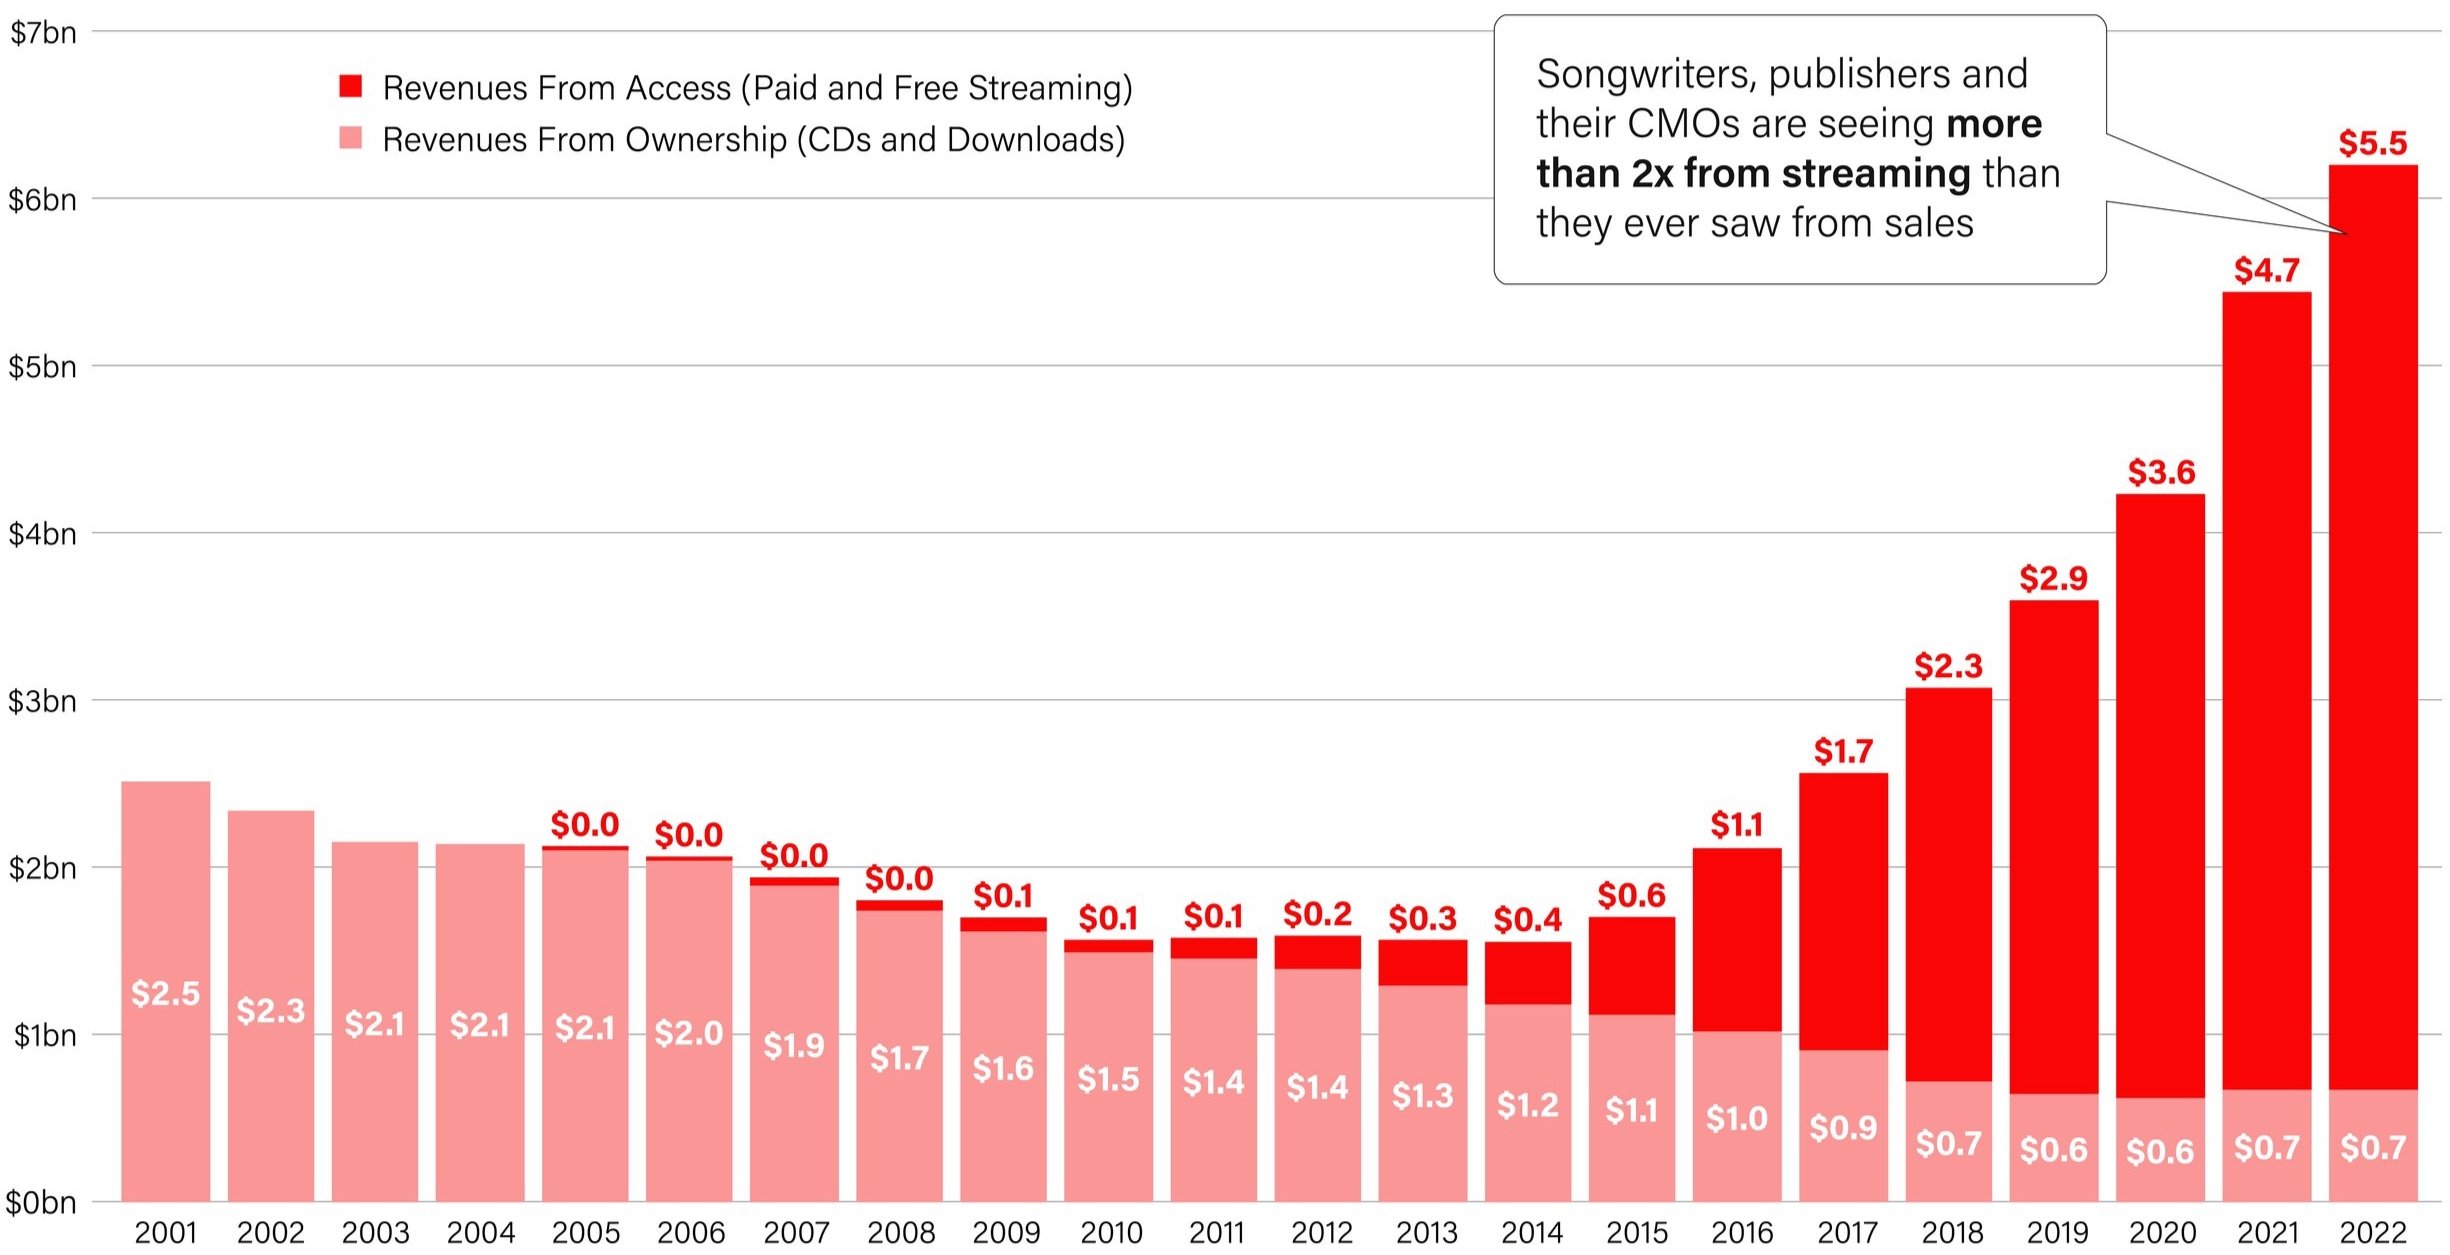
Source: IFPI Global Music Report based on USD$ 2022 Constant Currency, MIDIA and Will Page
Recall that the above analysis refers solely to business-to-consumer revenues from CDs, downloads and streaming, where songwriters, publishers and their CMOs tend to get the smaller share of the pie. If we switch lanes and look at their more favourable (and traditional) licensing territory of the business‑to‑business sector, the global value of their performing right income (i.e. general purpose, radio and television) was $3bn in 2001; that’s tripled to over $9bn in 2022. By comparison, labels’ and artists’ equivalent performance income today is only $2.5bn – less than what CMOs collected well over twenty years ago.
This is not to exhibit a preference for one side over another, rather a reminder that whilst we are (constantly) debating fairness when valuing copyright (as seen in the three-year long UK Government inquiring into streaming economics, to do so fairly we need to take a holistic view of the market and not cherry pick data to justify asking for more.
Image: Unsplash/Thibault Penin
The Price Isn’t Right
On one side of the street is the annual debate about value – what is copyright worth and who gets what share? On the other side is a perennial debate over price: how much is the consumer paying to access all the world’s music – offline, on-demand and ad-free – for a month. Proponents argue that it is precisely the charm price of 9.99 (in Euros, Dollars and Sterling) that has seen streaming revenues grow from under $1bn ten years ago towards $20bn today. Critics may point to comparator products like Netflix which has more than doubled in price in under a decade.[2]
In my publication Malbeconomics: Taking stock of the twentieth anniversary of the 9.99 price point, I tell the story of the origins of this 9.99 price point dating back to the USA on 3 December 2001, when Rhapsody got its licence to stream just 15,000 catalogue songs. Hilariously, the price was set to mirror the cost of a Blockbuster rental card. So let’s get mischievous and imagine if you were one of those early-bird Rhapsody subscribers, who has continued paying that price for almost 23 years – how does that price feel now?
To show how that 9.99 price set in 2001 feels today, we need to grapple with some stats through a quick crash course in deflators. To present the cost of music in what economists call ‘real terms’ we’ll use the personal consumption expenditures (implicit price deflator), which gives us our measure of what happened to consumers’ changing behaviour across a wide range of expenses. This has risen by 55% since 2001, eroding the value of the 9.99 price point down to $6.48 in real terms. To capture the commoditising effect, consider this: music has exploded in supply from 15,000 catalogue songs to over 100 million – yet has dropped by a third in price.
[2] At the time of writing, Netflix has just informed your author that his monthly fee is going to be raised to £17.99. I don’t intend to churn but would note that it’s now more than doubled and I use the service even less.
Standalone $9.99 Price, incl. Inflation Adjustment
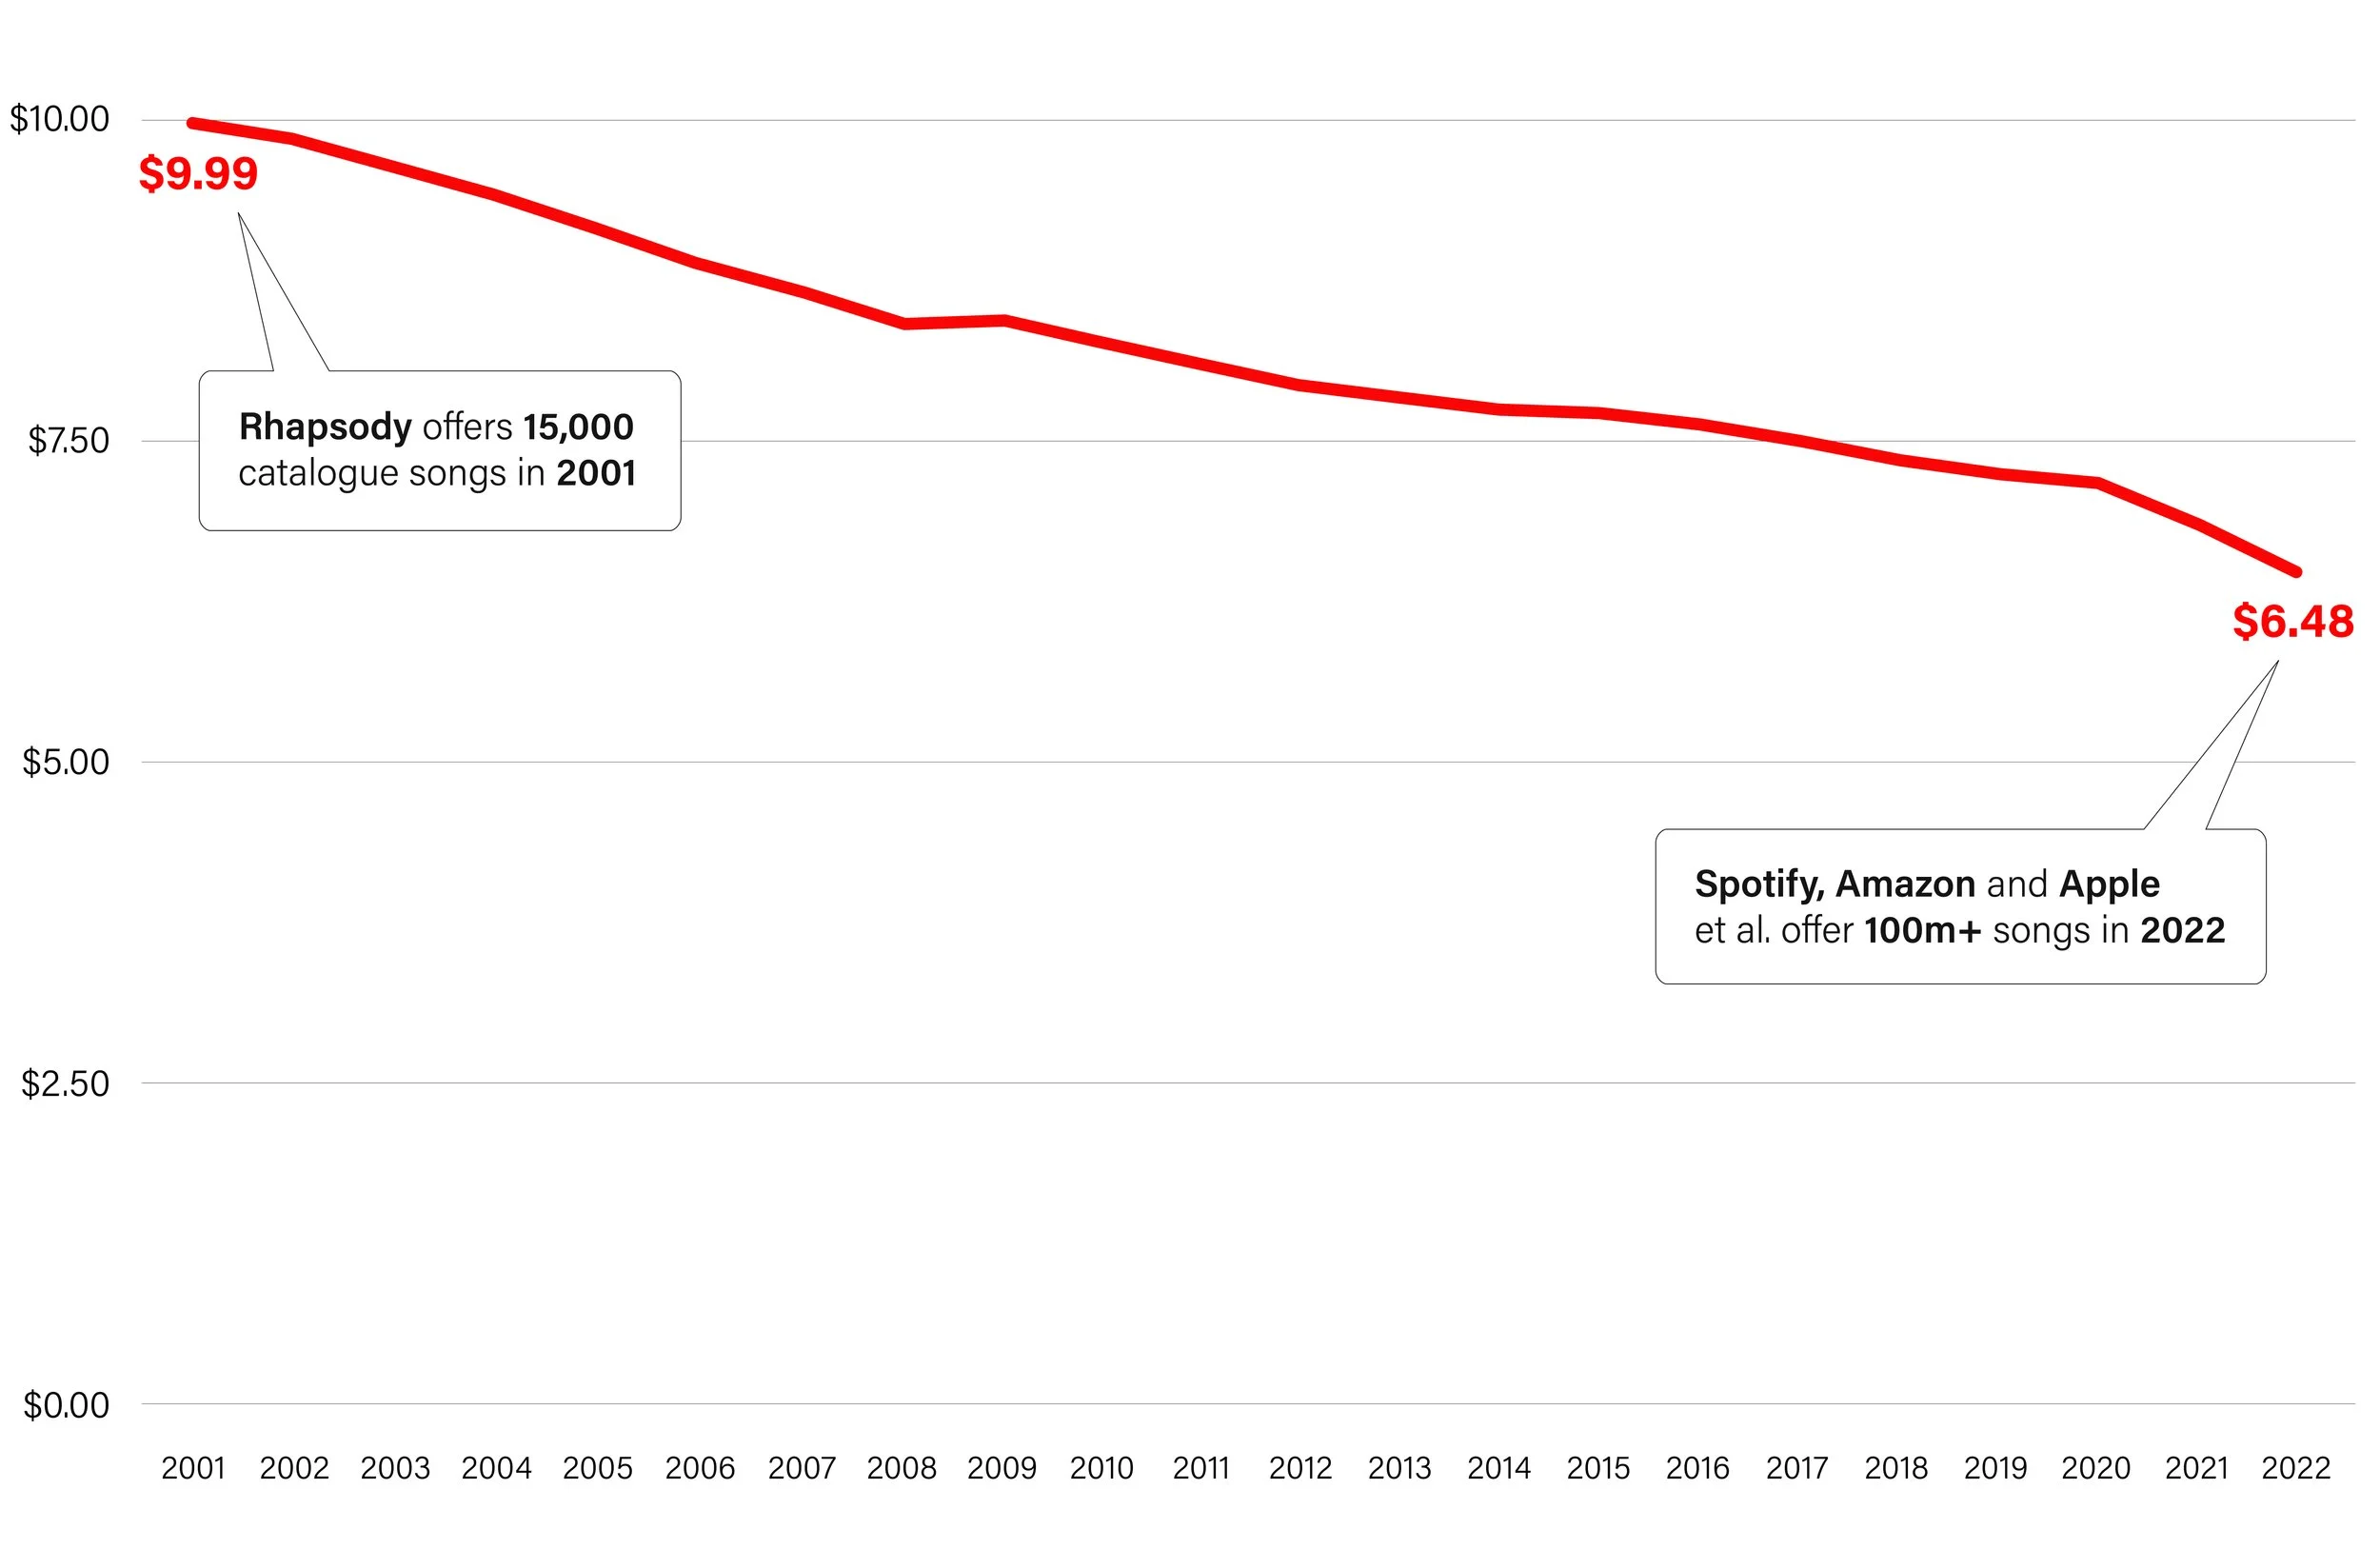
Source: Survey of Global Streaming Services, St Louis Federal Reserve and authors own calculations
Image: Adobe Stock/nikkimeel
But that’s just part of the story. When you consider family plans (and to a lesser extent student plans), which were launched by Spotify (2014), Apple (2015) and Amazon (2016), we can derive a cost per account holder. Some quick arithmetic tells you if there’s around three people on a family plan that costs $14.99, that’s around $5 each (incidentally, the same as a student plan). So how do we get a truer reflection of the real cost of music, given the introduction of these influential plans?
First, we need to restart the clock in 2016 Q4, when all major streaming services had family and student plans in the market. Second, we have to blend‑and-weight these across all offerings, across all services, into a consolidated headline figure. Third, we need to factor in the array of price increases to standalone, family and student plans towards the end of the time series. Amongst them, Spotify raised prices by a dollar in Q2 2021 and Q3 2023, Apple raised prices in Q4 2022 and Amazon raised pricing in Q3 2023.
So, if you began enjoying the benefits of paid music services in late 2016 (irrespective of whether you were paying the bill), how much does it feel like today? This chart surfaces a complex calculation. We start at $8.78 per account holder, and as the popularity of family and student plans grew, the nominal price fell to $7 by mid-2022, with the recent spate of price hikes picking that up to $7.86 today. Now, when we adjust for inflation, the cost-per-account collapses by almost a quarter to $6.58 – with only a slight uptick in the final quarter resulting from the price hikes in this new high-inflation era.
The Real Price of Music in the US, per Account User

Source: Survey of Global Streaming Services, BEA and authors own calculations
For American city-dwellers, the price of all the world's music offline, on-demand and ad-free, is less than a pint of Budweiser, but more than a cappuccino – although those living in Manhattan may (soon) disagree with the latter part of that statement. Yet this is a mischievous and hypothetical exercise; if you pay $10.99 for standalone Spotify today, it’ll feel like $10.99. But it does provoke three very important questions about pricing.
Firstly, to continue growing, subscription services need to acquire mainly Android users who are likely to be (a) lower-income and (b) less interested in music – so raising prices may stall this growth. Second, ‘mental budgeting’ is real – people set out their annual spending plans with a ceiling in mind for how much they’ll spend on music (i.e. concert tickets and subscription services) or streaming (i.e. Spotify and Netflix) – and there may be less budget available when concert tickets and Netflix have raised prices yet music has remained flat. Third, the re-emergence of inflation reminds us that Spotify has never existed in a market where interest rates were above inflation. As these two variables finally correct themselves, with interest rates rising and inflation falling, so too must the price of music – for customers and investors buying and selling catalogues.

Image: Unsplash/Linus Sandvide
Smoke Signals
Our weekly podcast Bubble Trouble is about to celebrate its 100th episode with an exclusive interview with Andy Fastow, the former CFO of Enron – arguably the biggest bubble in corporate history. On the show, my co-presenter Richard Kramer, founder of Arete Research, often moves the latter half of our conversations to a ‘smoke signals’ segment, asking our guest to flag a couple of those ‘uh-oh’ moments they see coming when they step back from the hype and hysteria, or to bring cringeworthy terminology or click-bait headlines down to size. Considering this research shows music copyright is now a $40bn business, it’s prudent to curb our enthusiasm and do a little smoking here.

Image: Adobe Stock/AboutLife
Is old music really killing new music?
Ted Gioia, a respected music historian and essayist, created a stir with the provocative headline ‘Is Old Music Killing New Music?’, arguing old songs now represent 70 percent of the U.S. music market and claiming the new-music market is shrinking. Where he’s right is that catalogue is making up a bigger share of overall streams than ever before. Where he’s wrong is in using an 18-month threshold for defining ‘old.’ Here’s the smoke signal: ignore this antiquated catalogue rule. As I argued in 2017, the definition of catalogue needs an upgrade, because when you monetise downstream consumption (rather than upfront consumption), “catalogue” isn’t fit for purpose.
The chart below deals with Ted's ‘click-bait’ headline. Luminate Data, the industry’s preeminent data company, produced the top 500,000 global streams for 2022 – which captures almost 90% of streams that year. Bucketing this into decades based on the label release dates shows that 40% of all streams were from this current decade, 40% were from the decade prior and another 11% from the noughties. (A broadly similar story exists for the U.S.). That means all music made before the millennium makes up less than 10% of global demand.
Old music is not killing new music; rather, our antiquated definition of old isn’t that old afterall.
2022 Global Streaming Share By Age of Song
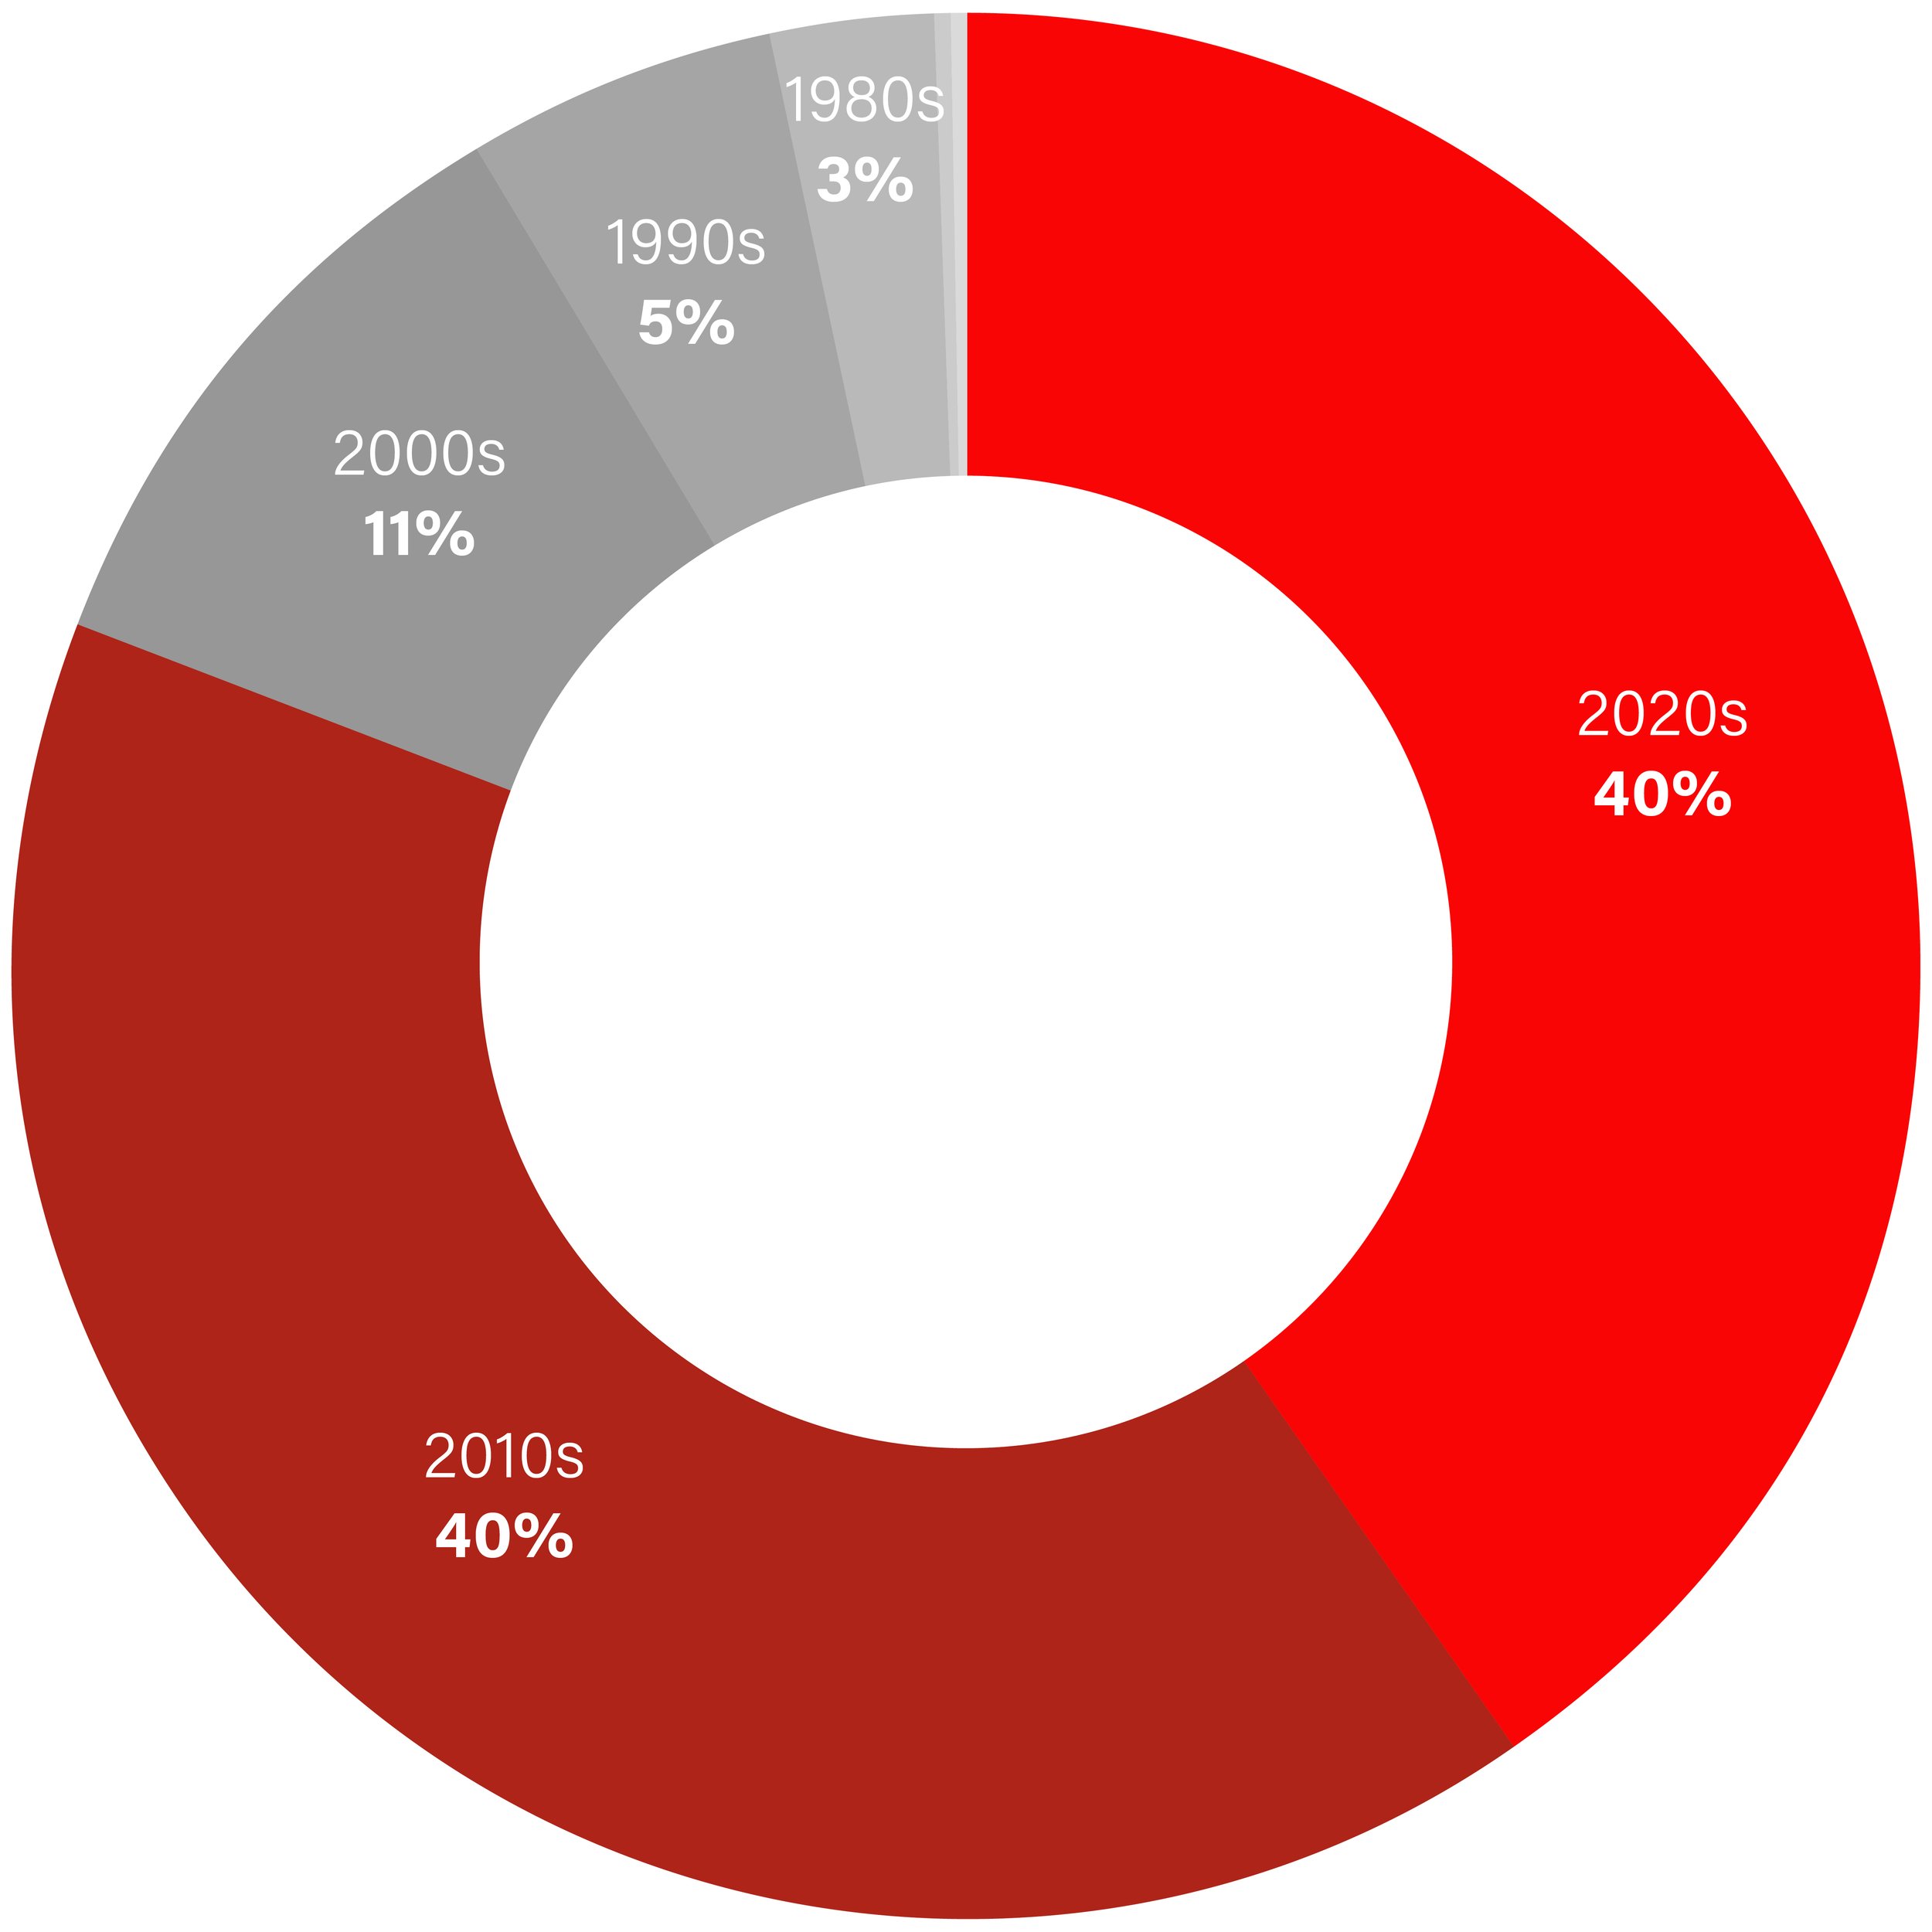
Source: Luminate Data
Are we failing to size the market?
This report assembles and consolidates three official data sources: IFPI, CISAC and official accounts of music publishers, but there is a fourth source of data that merits close attention. MIDIA, a respected consultancy, publishes its estimates for the retail and wholesale value of recorded music every year, and does so with bigger figures than official sources state. Take streaming: MIDIA puts the global value at $18.9bn, whereas the IFPI states $17.5bn – putting the former 10% higher. Indeed, the MIDIA figures trump the IFPI across all the revenue sources, with video streaming revised up by as much as 20%-30%. All in, MIDIA puts global recorded music at $28bn in 2022, $1.9bn more than the IFPI.
This is more than just a discrepancy. If you've read this far, your profession (or studies) will depend on knowing the numbers presented here are correct. Typically, trade bodies collect revenues from major label partners and some indies, and use this ‘known-known’ figure to guess-timate the true size. How much that “known-unknown” market is worth is where both parties appear to diverge. MIDIA, to its credit, has arguably done more homework on: artists direct (or the unfortunately presumptive term ‘DIY sector’) which makes up 1-in-10 of all streams; the true size of indie labels; and the emerging Asian powerhouses like the Korean music market where the combined major label market share is less than a quarter.

Image: Adobe Stock/Alexander Raths
What does this mean? It means if MIDIA’s methodology is right, the global value of music copyright is closer to $45bn than $40bn. And if copyright grew by $5bn this year, we could be talking about a $50bn business a lot sooner than you think.
And if that happens, the global value of copyright will have doubled in size from the $25bn I reported for 2014 in Music Business Worldwide, back when this calculation was first performed.
And that would bookend an incredible decade‑long streaming-led success story that would be the envy of every other media vertical.
Acknowledgements
A huge debt of thanks to Chris Carey (FFWD) for cranking out the global value of copyright and the modelling skills of Nicholas Lightle for calculating the real price of music over time. In addition, thanks to Gadi Oron, Adrian Strain and Sylvain Piat (CISAC); John Blewett and Lauri Rechhardt (IFPI); Simon Dyson (Omdia); Jaime Marconette, Scott Ryan and Jimmy Harney (Luminate Data); Mark Mulligan (MIDIA); Ger Hatton (Independent Music Publishers International Forum); Ralph Simon (Mobilium); Tom Frederikse (Clintons); Shannon Nitroy (Spotify); Bill Gorjance (peermusic); Fred Goldring and Bill Hein (Pressing Business); Chris Dalla Riva (Audiomack); Jessica Powell (Audioshake); Yoshio Osaki (IDG Consulting); Chris Deering; Stewart McKie; David Safir and many music industry executives from streaming services, labels, publishers, and CMOs who made this possible. Special thanks to the incredible wordsmith Sam Blake for copy‑editing and making this calculator comprehensible and Alice Clarke for design and infographics.