
Many teams struggle with understanding how to measure, track, and prove the efficacy of their DesignOps efforts for a number of reasons:
- In organizations where DesignOps isn’t widely understood or officially embraced, there is little support or ability for investing resources in measuring its impact.
- Many DesignOps professionals are teams of one. This person is typically focused on damage control through necessity (at least early on) and doesn’t have the bandwidth or opportunity to proactively implement measurement programs alongside their DesignOps work.
- DesignOps goals and priorities are often unclear. Teams can’t measure the effectiveness of the practice if they don’t agree on the overall purpose of DesignOps or what they hope to achieve through DesignOps.
- In some organizations (e.g., scattered structures), DesignOps activities may be too siloed. Even if individual people or teams are tracking the success of granular programs, measuring independent activities doesn’t provide an accurate picture of how the practice is performing at large.
Measuring DesignOps Is Difficult
The truth is that measuring DesignOps is difficult even in the best of circumstances, because changes in success metrics will often be difficult to attribute to any kind of change in DesignOps efforts. In small organizations or teams, there’s unlikely to be statistically significant growth in any metric, so it would be near impossible to understand the cause of any changes in those metrics. Even for larger organizations, teams may not be able to gather enough data points for typical DesignOps success metrics (e.g., attrition rates, number of projects that include design roles, number of design iterations on a project, etc.) to truly understand causation.
However, DesignOps teams do have a responsibility to understand whether their efforts are supporting their high-level goals and having a positive impact on design. Teams that are able to convince stakeholders and partners that their efforts have a high return on investment will have an easier time securing ongoing support and investment for DesignOps. Plus, they’ll feel good about the value they provide.
When results cannot be statistically “proven,” DesignOps teams can use triangulation, which means analyzing several different metrics related to DesignOps efforts in concert in order to understand overall impact. The REACH framework described below provides an outline of potential metrics to track and triangulate, depending upon the specific goals of the DesignOps team.
Identifying Metrics with the REACH Framework
You cannot answer the question of what to measure without first figuring out the intended value of DesignOps at your organization and the goals of your DesignOps efforts. Like any UX project, measuring DesignOps requires identifying goals and aligning metrics that can indicate whether those goals are on track.
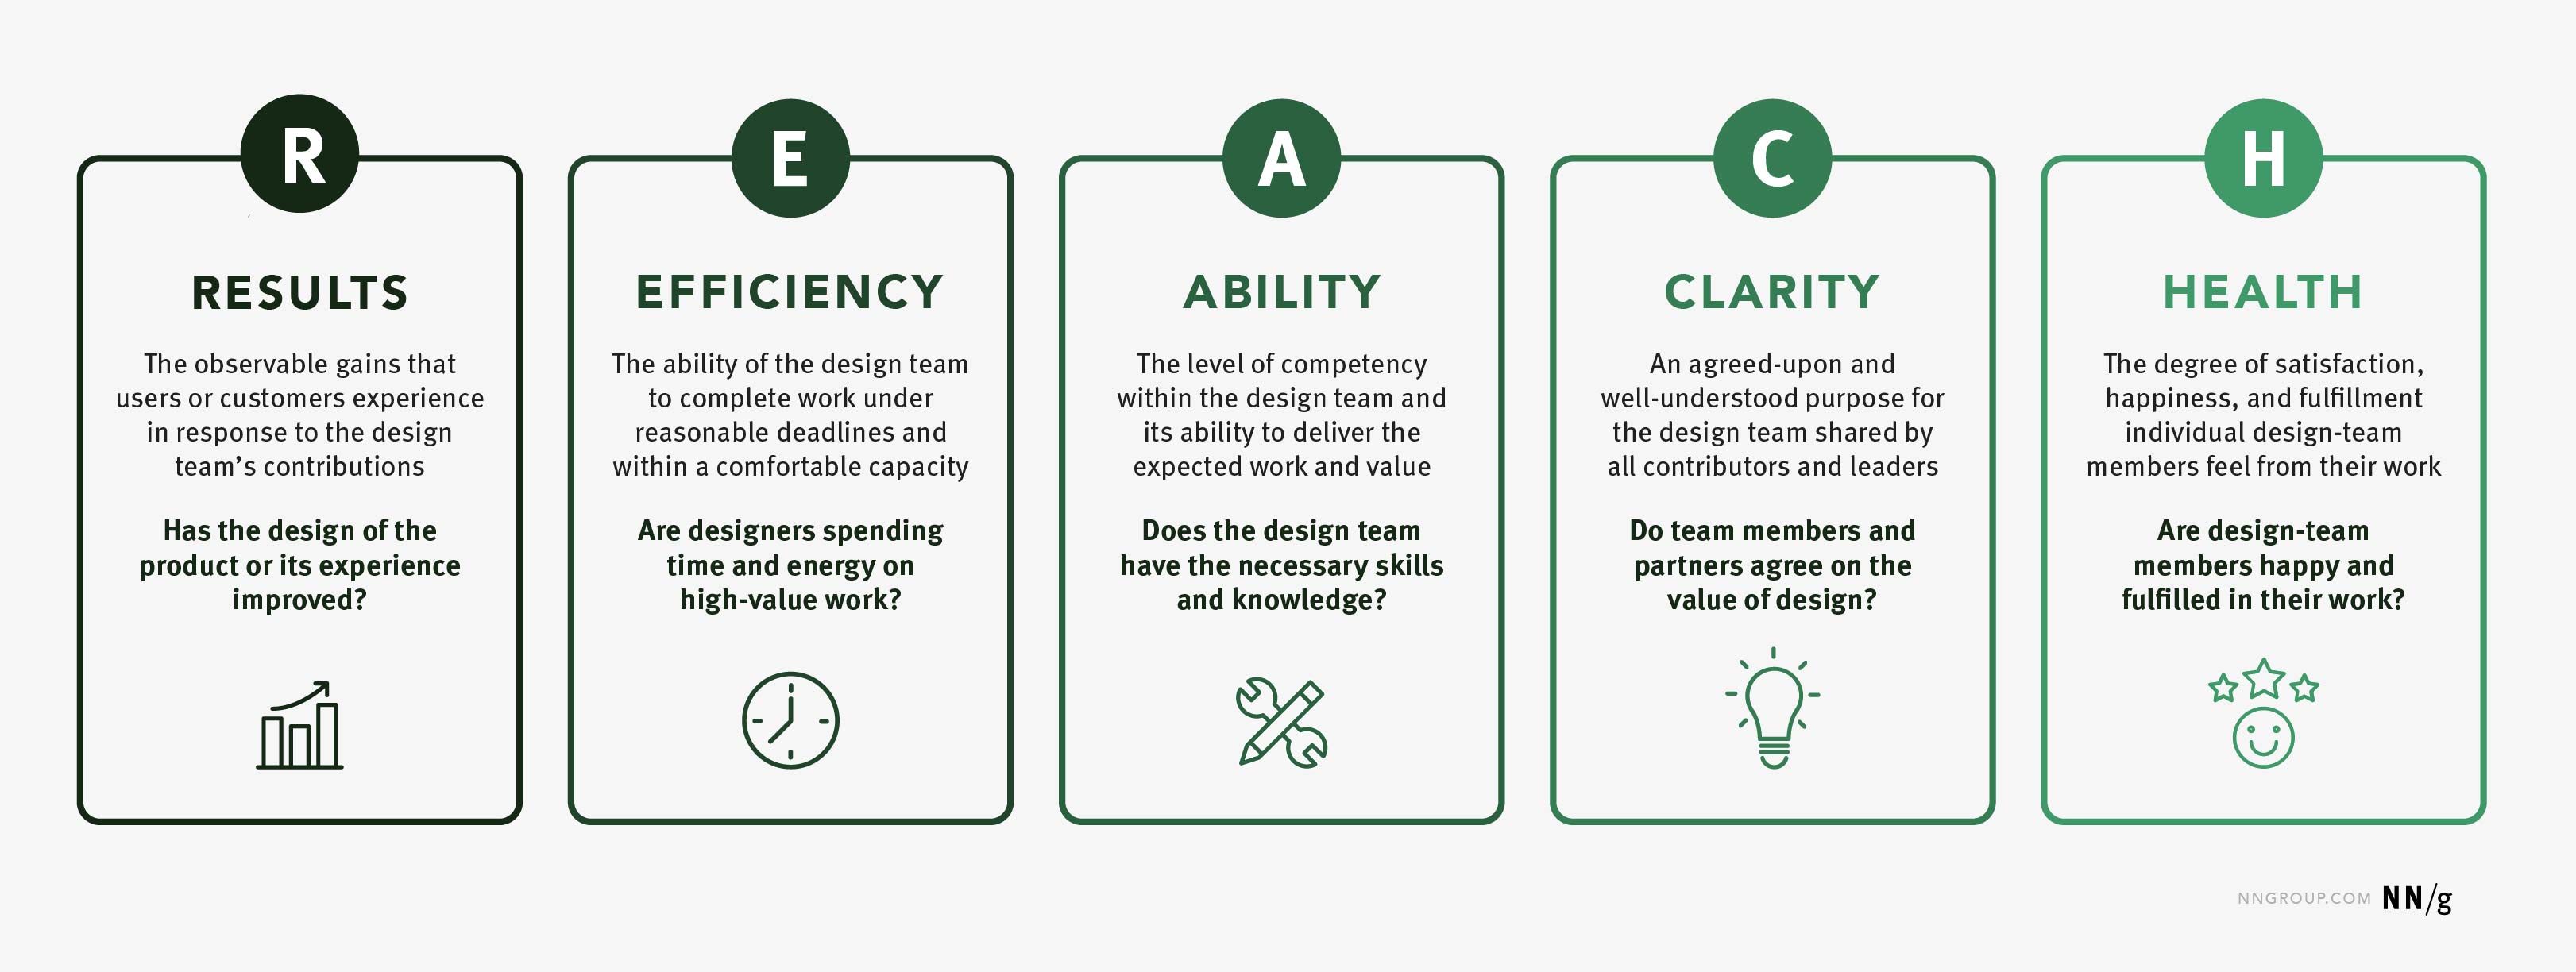
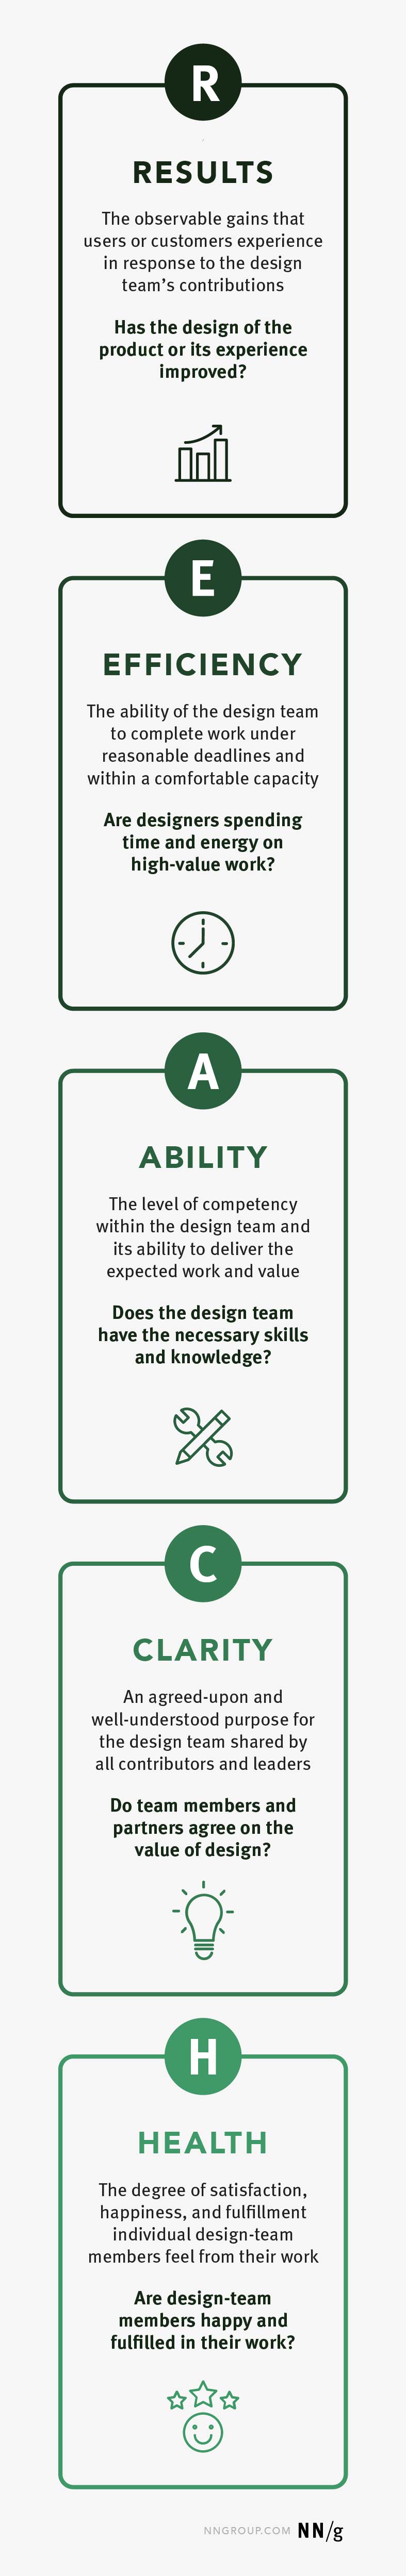
The REACH metrics framework described below comprises 5 common high-level DesignOps goal categories:
- Results: Has the design of the product or its experience improved?
- Efficiency: Are designers spending their time and energy on high-value tasks?
- Ability: Are the necessary skills and knowledge present and accessible within the design team?
- Clarity: Do both design-team members and external partners understand and agree upon the value that design provides?
- Health: Are design-team members happy and fulfilled in their work?
R = Results
Results are the observable gains that users or customers experience in response to the work done by the design team. Some DesignOps teams might aim to support the design team by impacting the quality of work produced. If so, tracking experience-based metrics can help determine if there are additional or different DesignOps efforts that would better support the design team. The assumption here is that a better-supported design team will be enabled to create better designs.
To understand how results are progressing, we might try to answer questions such as:
- Have design outputs improved since or because of implementation of DesignOps programs or efforts?
- Are design deliverables better, easier to understand, or utilized by external partners more often?
- Has the overall experience or product improved?
- Are users more satisfied with the product?
Results Metrics:
Consider benchmarking the following metrics:
- User-satisfaction ratings
- Frequency of use
- Questionnaire scores (e.g., NPS, SUS, SPR-Q)
- Success and error rates
- Design-quality scores
Some of these metrics may be already being collected at your organization to understand if design changes are effective. Therefore, the team can refer to results to confirm that a redesign is effective at the very least. If a redesign is not effective, then there could be DesignOps issues that need to be addressed — and other metrics may point the team to more specific issues.
E = Efficiency
Efficiency is the ability of the design team to complete their core tasks (i.e., design-related work) without bottlenecks or obstacles, under reasonable deadlines and scopes, and within a comfortable workload capacity.
If improving efficiency is a focus area, DesignOps might be concerned with understanding the following:
- Is the design process effective and repeatable?
- Are there areas of waste or redundancy in the design process?
- Can design-team members focus on design and research work or are they overly burdened with operational tasks?
- Are design processes repeatable and scalable?
- Are designers distracted or overloaded by unnecessary meetings or activities?
Efficiency Metrics:
Efficiency is not a measure of simply how much work the design team can output. The following metrics can help the DesignOps team understand if the amount of expected design work can be done comfortably and to the level of desired quality:
- Average time spent on operational tasks vs. maker time (time spent designing) per week
- Percentage of design requests handled in a given time period
- Average number of design iterations on a project
- Percent of deadlines met
- Time to delivery for specific tasks or types of projects
- Number of identified critical vs. noncritical activities
- Amount of UX or design debt
A = Ability
Ability is the level of competency within the design team and its capacity to deliver the work and value expected of it. Measuring ability can help answer:
- Are the right roles in place within the design team?
- Is the team as a whole competent across the necessary skillsets?
- Are there gaps in skills across the design team that need addressing?
- Do designers have access to appropriate resources to develop their skills?
- Is growth enabled and supported as needed?
Ability Metrics:
The following metrics can help the DesignOps team understand the design team’s level of ability and the level of available support for development:
- The ratio of existing skills to skills identified as necessary for the design team to be effective (e.g., through skill-mapping activities)
- Frequency of skill-development opportunities
- Percent of employees aware or making use of trainings, workshops, or other educational opportunities
- Percent of projects that adhere to the established design process
- Perception/satisfaction of external teams who request work from the design team
- Accuracy of timeline estimation
- Number of instances of collaboration or mentorship
C = Clarity
Clarity is having an agreed-upon and well-understood purpose for the design team. Those DesignOps teams concerned with improving clarity want to understand:
- Does the design team have a clear, shared vision?
- Are priorities agreed upon among the team and shared by leadership?
- Do external partners understand what the design team does and how to engage with them?
- Is the overall value that the design team provides known and appreciated?
- Is the team asked to contribute in the appropriate ways at appropriate times?
Clarity Metrics:
Some metrics that could be tracked to understand progress toward increasing clarity might be:
- Percent of designers who agree there is a well-established vision
- Percent of external partners who are aware of design-team contributions and successes
- Percent of projects or processes in which the design team is included
- Mentions/features in newsletters, case studies, executive readouts, and so on
- Number of design roles in leadership or executive-level positions
H = Health
Health is the overall satisfaction of the design team. Tracking health seeks to understand:
- Are design-team members satisfied with their job?
- Do they find the work fulfilling?
- Are they likely to stay at the company long term?
- How do designers feel about their team and organizational culture?
- Does the design team feel it is delivering its best value?
- Do designers feel engaged and motivated?
Health Metrics:
The following metrics can indicate design-team’s health:
- eNPS (employee net promoter score)
- Employee-engagement scores
- Attrition and retention rates
- Approval ratings for advancement opportunities, work environment, recognition, compensation, or any other number of satisfaction indicators
Health metrics can be collected and tracked with quarterly pulse surveys (short surveys sent to the team on a regular basis that ask individuals to provide ratings for a number of satisfaction measures).
How and When to Benchmark DesignOps Metrics
DesignOps teams don’t necessarily need to collect data for all the categories in the REACH framework. Teams can prioritize one or more categories that are current focus areas for improvement at any given time.
The time to begin benchmarking REACH metrics is as soon as the DesignOps role or team is established. Create a baseline snapshot of important indicators before DesignOps efforts are launched. How often to benchmark is a question of feasibility and expense and may depend on other processes in place. Depending on the size and speed of the DesignOps practice, a good rule of thumb is to benchmark quarterly or biannually.
Just remember that, even with a sound benchmarking program in place, many teams may not be able to ever know with confidence that changes are the results of DesignOps efforts. However, through triangulation, we might be able to observe that several metrics are moving in the right direction, which would be good news and convincing data for helping others understand and believe in the worth of DesignOps programs.
Measuring Individual DesignOps Programs
Rather than relying solely on tracking overall DesignOps success, teams should also seek to understand the success of individual DesignOps programs.
For example, if the DesignOps team launches a training workshop with the goal of educating nondesigners about design activities, some goals of the program might be to:
- Increase the percentage of nondesigners who understand how to use a certain method by x
- Increase the number of teams including design activities in their processes by x
- Decrease the number of requests to the design team to facilitate a certain process over a period of one year (to relieve the design team of a process that could be easily automated or managed by others)
These are essentially objectives and key results (OKRs) for individual DesignOps efforts that can be used to determine if those efforts are worth continued investment or if additional iteration or experimentation is required. While the ability to see a significant increase dramatically depends on the size of the organization and the number of teams supported by DesignOps, OKRs can still provide signals that point to success or failure. REACH categories provide a starting point for defining key results, depending on the program and objective.
Apply REACH to the DesignOps Team, Also
It’s a worthwhile strategy to attempt to understand the efficacy of DesignOps by understanding how well the design team is enabled and supported. (That’s how this article outlines using the REACH framework.)
However, larger DesignOps teams — especially those operating within distributed or elevated DesignOps structures — can benefit from applying the REACH framework to themselves, as well as the design team. Frame the high-level categories from an internal perspective to understand the state of the DesignOps team itself:
- Results: Is the orchestration of design — people, process, and craft — improved over time?
- Efficiency: Are DesignOps team-members able to focus on DesignOps work, or are they tasked with peripheral projects better suited for other types of roles?
- Ability: Are the right skills in place to effectively manage and sustain the DesignOps practice?
- Clarity: Does the organization understand the value of DesignOps and does it understand the work and goals of the DesignOps team?
- Health: Are DesignOps team members fulfilled and are they motivated to contribute and grow long term with the organization?
Conclusion
Though it can feel daunting, tracking indicators of DesignOps success is worth the effort. Recently established or experimental DesignOps teams especially may have increased pressure to demonstrate wins or convince others that investment in DesignOps is substantiated.
Though in most situations, it’s difficult to “prove” the success of DesignOps efforts — again, changes in many of these metrics may be happening due to DesignOps efforts, something else, or pure coincidence — understanding overall trends can help practitioners create compelling arguments that DesignOps is necessary and valuable. The REACH framework provides a selection of metric categories to consider watching and triangulating when attempting to understand and communicate the impact of DesignOps.