Chart Spark
Harness your creativity in data communication to stand out and innovate
Alli Torban
“A perfect starting point for dataviz practitioners who might be intimidated by the creative process.”
—Stefanie Posavec, Designer, Artist, and Co-Author of Dear Data
Who's it for?
Don't panic when it's time to brainstorm new dataviz ideas. I give you a process to follow in this book! Get your copy in paperback, ebook, PDF, or audiobook.
If you answer yes to any of the following questions, then you’re in the right place:
Do you want to visually communicate data in new, impactful, and creative ways?
Do you want to be valued for the way you think, not how well you use software tools?
When you see someone else’s creative work, are you overwhelmed by how such an idea even began?
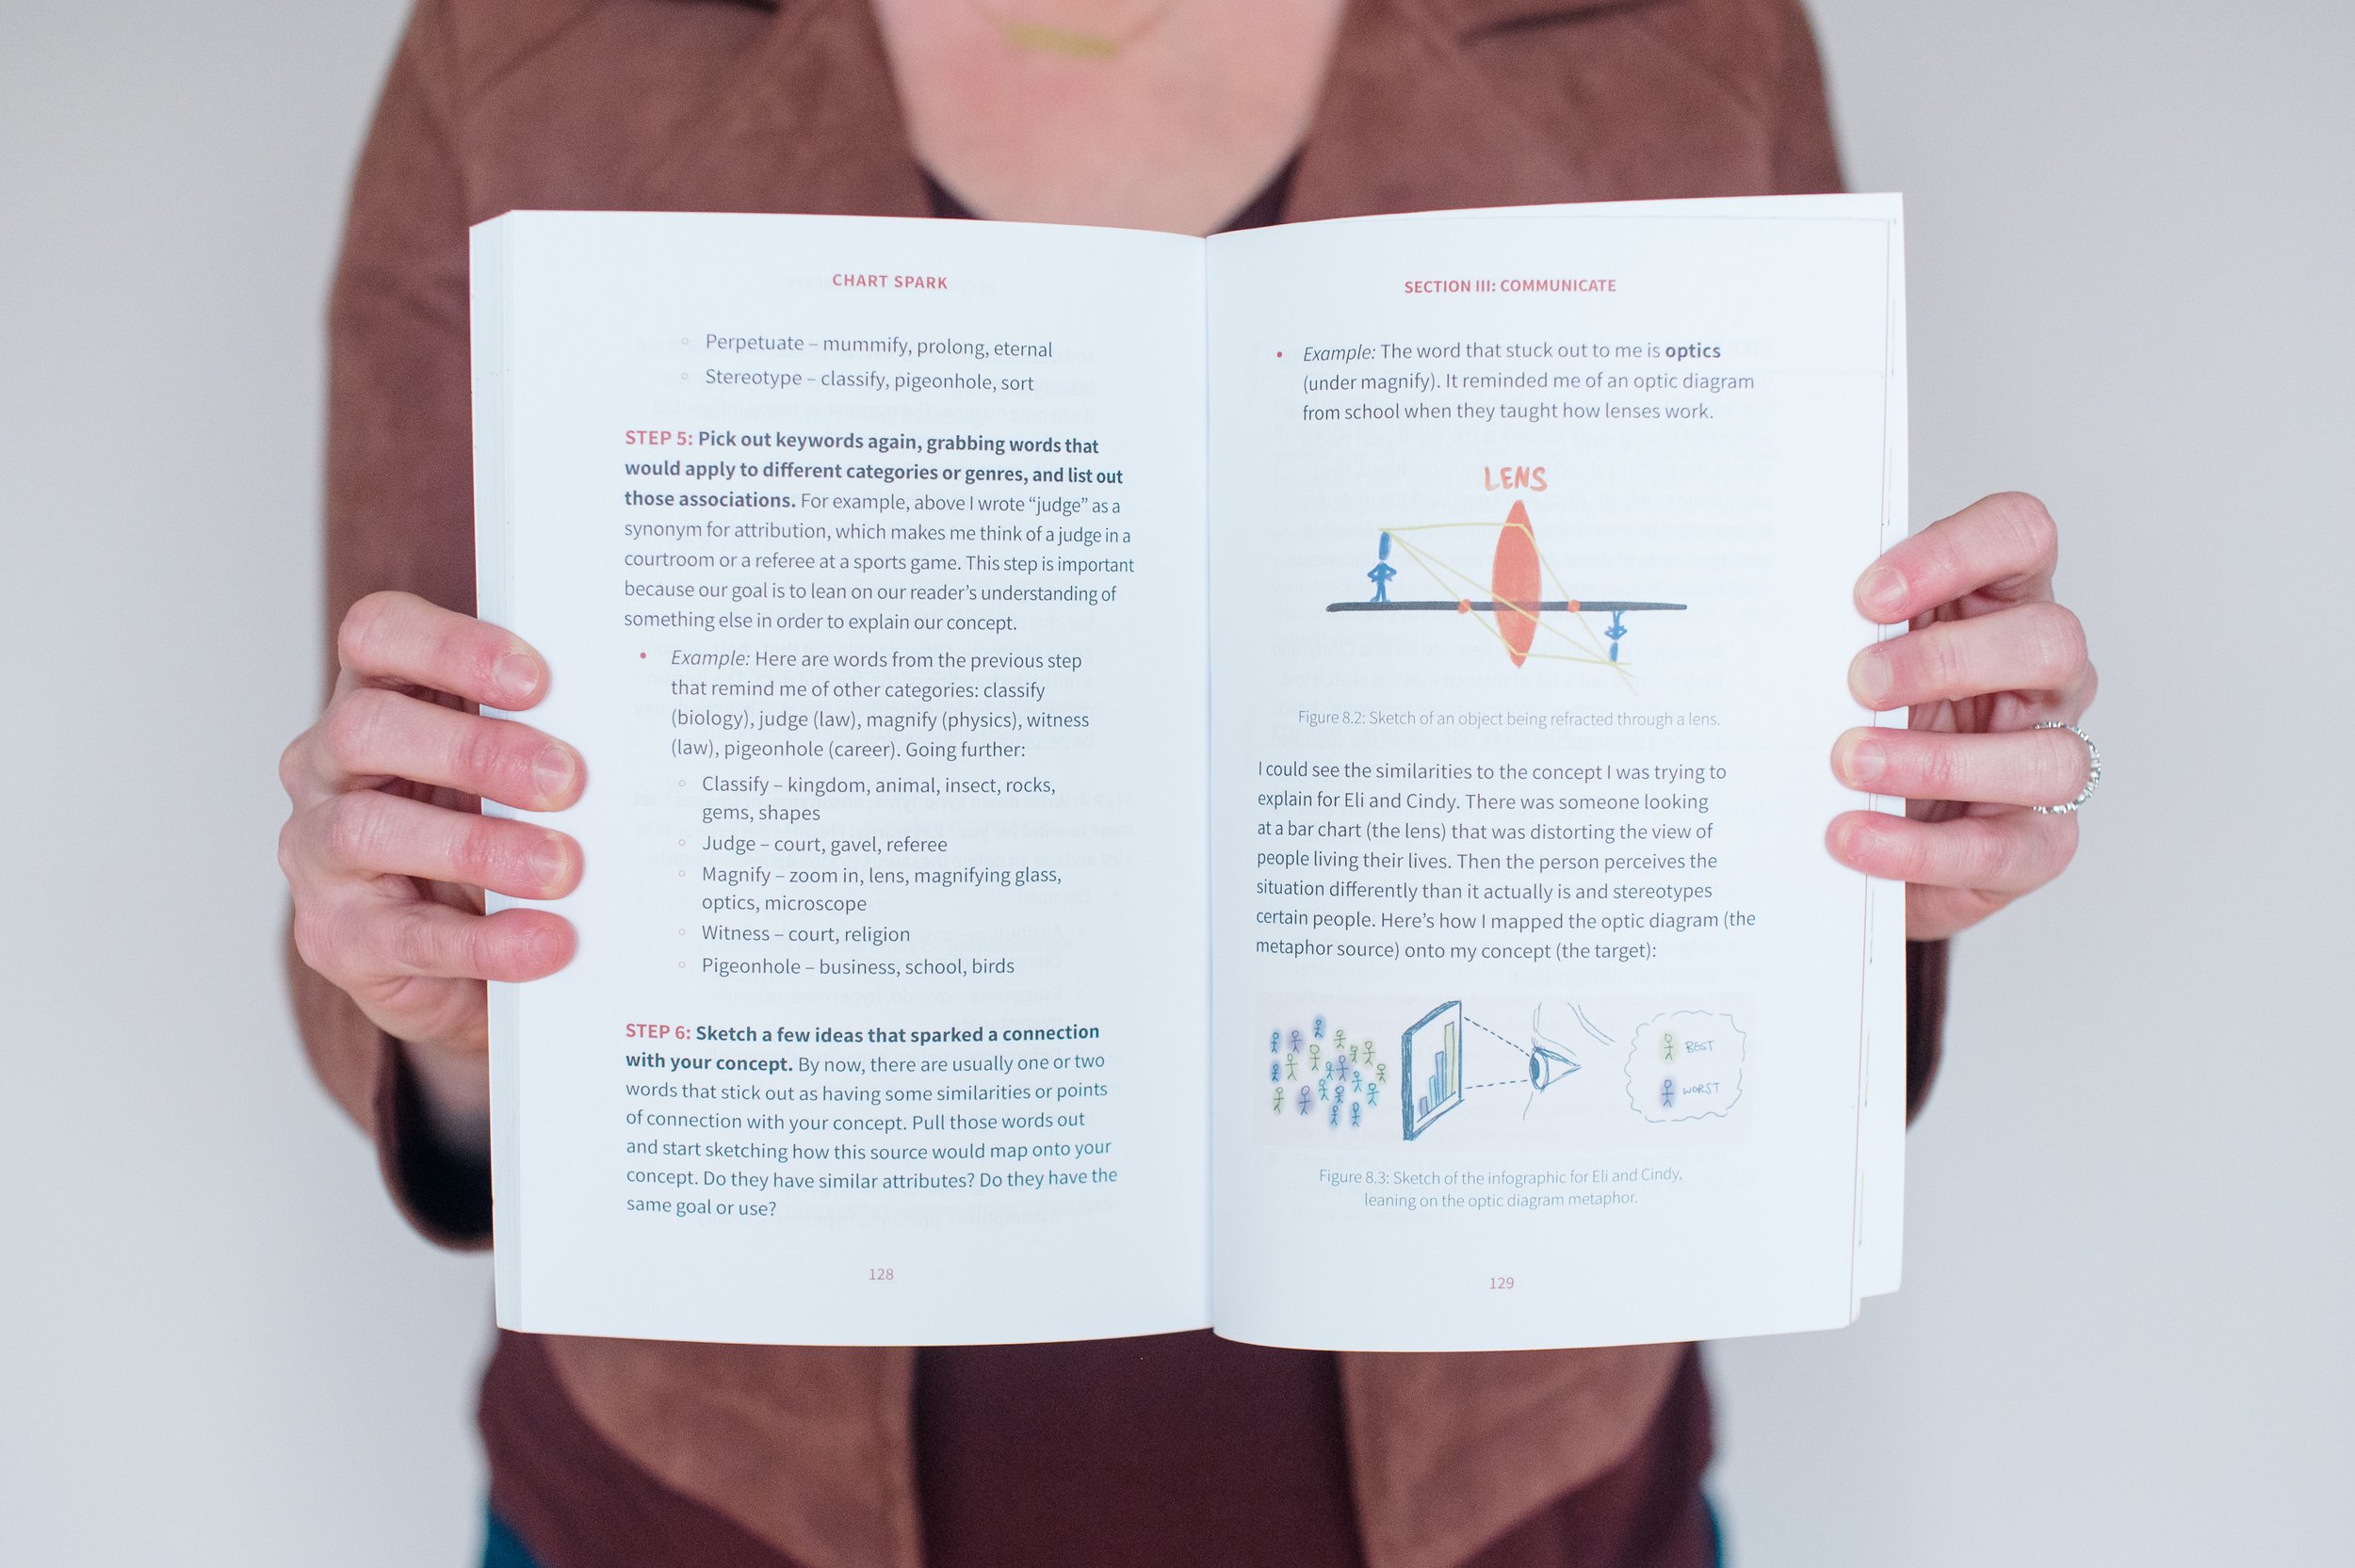
It's not another “inspiration book” filled with glossy infographics; instead, it's a practical guide designed to change your perspective on creativity and integrate it into your work. Each chapter includes actionable prompts designed to trigger your creativity, rather than just admire the finished product of others.
As an acclaimed information designer and host of the popular podcast Data Viz Today, Alli Torban understands the struggles faced by data professionals who don't identify as “creative types.” She shares her journey from data analyst to creative information designer and distills years of experience and interviews with successful data visualization designers into this concise, actionable book.
“This book is neatly constructed into logical chapters that help everyone, regardless of background, grasp the basics and then elevate their creativity
step-by-step.”
—Andy Kirk, Independent Data Visualisation Expert
You’ll learn how to…
See creativity in a new way.
Care for your innate creativity.
Use prompts to coax it out when you need it.
Generate new ways to communicate your creative ideas.
Transformations in Every Chapter
Introduction: What is creativity and why should you care?
Section I: CARE
Chapter 1: Expand your mental boundaries with the 'Bad Gifts' prompt
Chapter 2: Cultivate your inspiration with the 'X-RAY' prompt
Chapter 3: Build your habits with the 'Recess List' prompt
Section II: COAX
Chapter 4: Blast through project paralysis with the 'Idea Isosceles' prompt
Chapter 5: Immediately see through a new lens with the 'Break-the-Box' prompt
Chapter 6: Find stories like an editor with the 'CTR' prompt
Section III: COMMUNICATE
Chapter 7: Find an appropriate balance with the '4Q' prompt
Chapter 8: Explain it with a visual metaphor with the 'Haystack' prompt
Chapter 9: Mix different mediums and experiences with the 'Tango' prompt
Conclusion: What should you do next?
Interviews
Featured magazine spread in the Royal Statistical Society’s Significance Magazine
Data Visualization Society’s Nightingale Journal book review: “Taken as a cohesive work, Chart Spark is a practical guide to increasing and maintaining creative output with accessible and actionable prompts at the conclusion of every section.”
Make 2024 Your Most Creative Year Yet: Dataviz DC recorded talk on YouTube
Audit Your Inspiration: Information is Beautiful Awards featured workshop recording on YouTube
Questions in Dataviz book review: “It’s not a large or overwhelming book, to the extent that I sat down and read it in one long session, but it leaves you knowing that it is full of tips to dive back into whenever you need to look for or remember advice on getting started or presenting your creative dataviz.”
Xcalibur book review: “Journeying through Chart Spark, I developed a new found knowledge of where creativity comes from, how to seek it from deep within myself, and that creativity itself can be small but powerful.”
Little Miss Data book review: “In classic Alli fashion, she not only makes the idea of creativity approachable, she shares easy creativity exercises with a data lens to help you work through your discovery journey.”
“If you follow Alli’s guidance and prompts, it will change the way you think about creativity.”
—Steve Wexler, Co-Author of The Big Book of Dashboards
Lots more!
Podcast
Need a speaker at your event or training for your team? I love inspiring data people to think more creatively in concrete ways. Drop your details below, and I’ll back to you within 24 hours. 📊⚡
Contact
Newsletter


